- Home
- Work
Client Stories
- 2.5 year relationship
- 3 core journeys
- 1000+ participants & customers contributing to testing
- 2.5 year relationship
- 3 core journeys
- 1000+ participants & customers contributing to testing
- 2.5 year relationship
- 3 core journeys
- 1000+ participants & customers contributing to testing
- 2.5 year relationship
- 3 core journeys
- 1000+ participants & customers contributing to testing
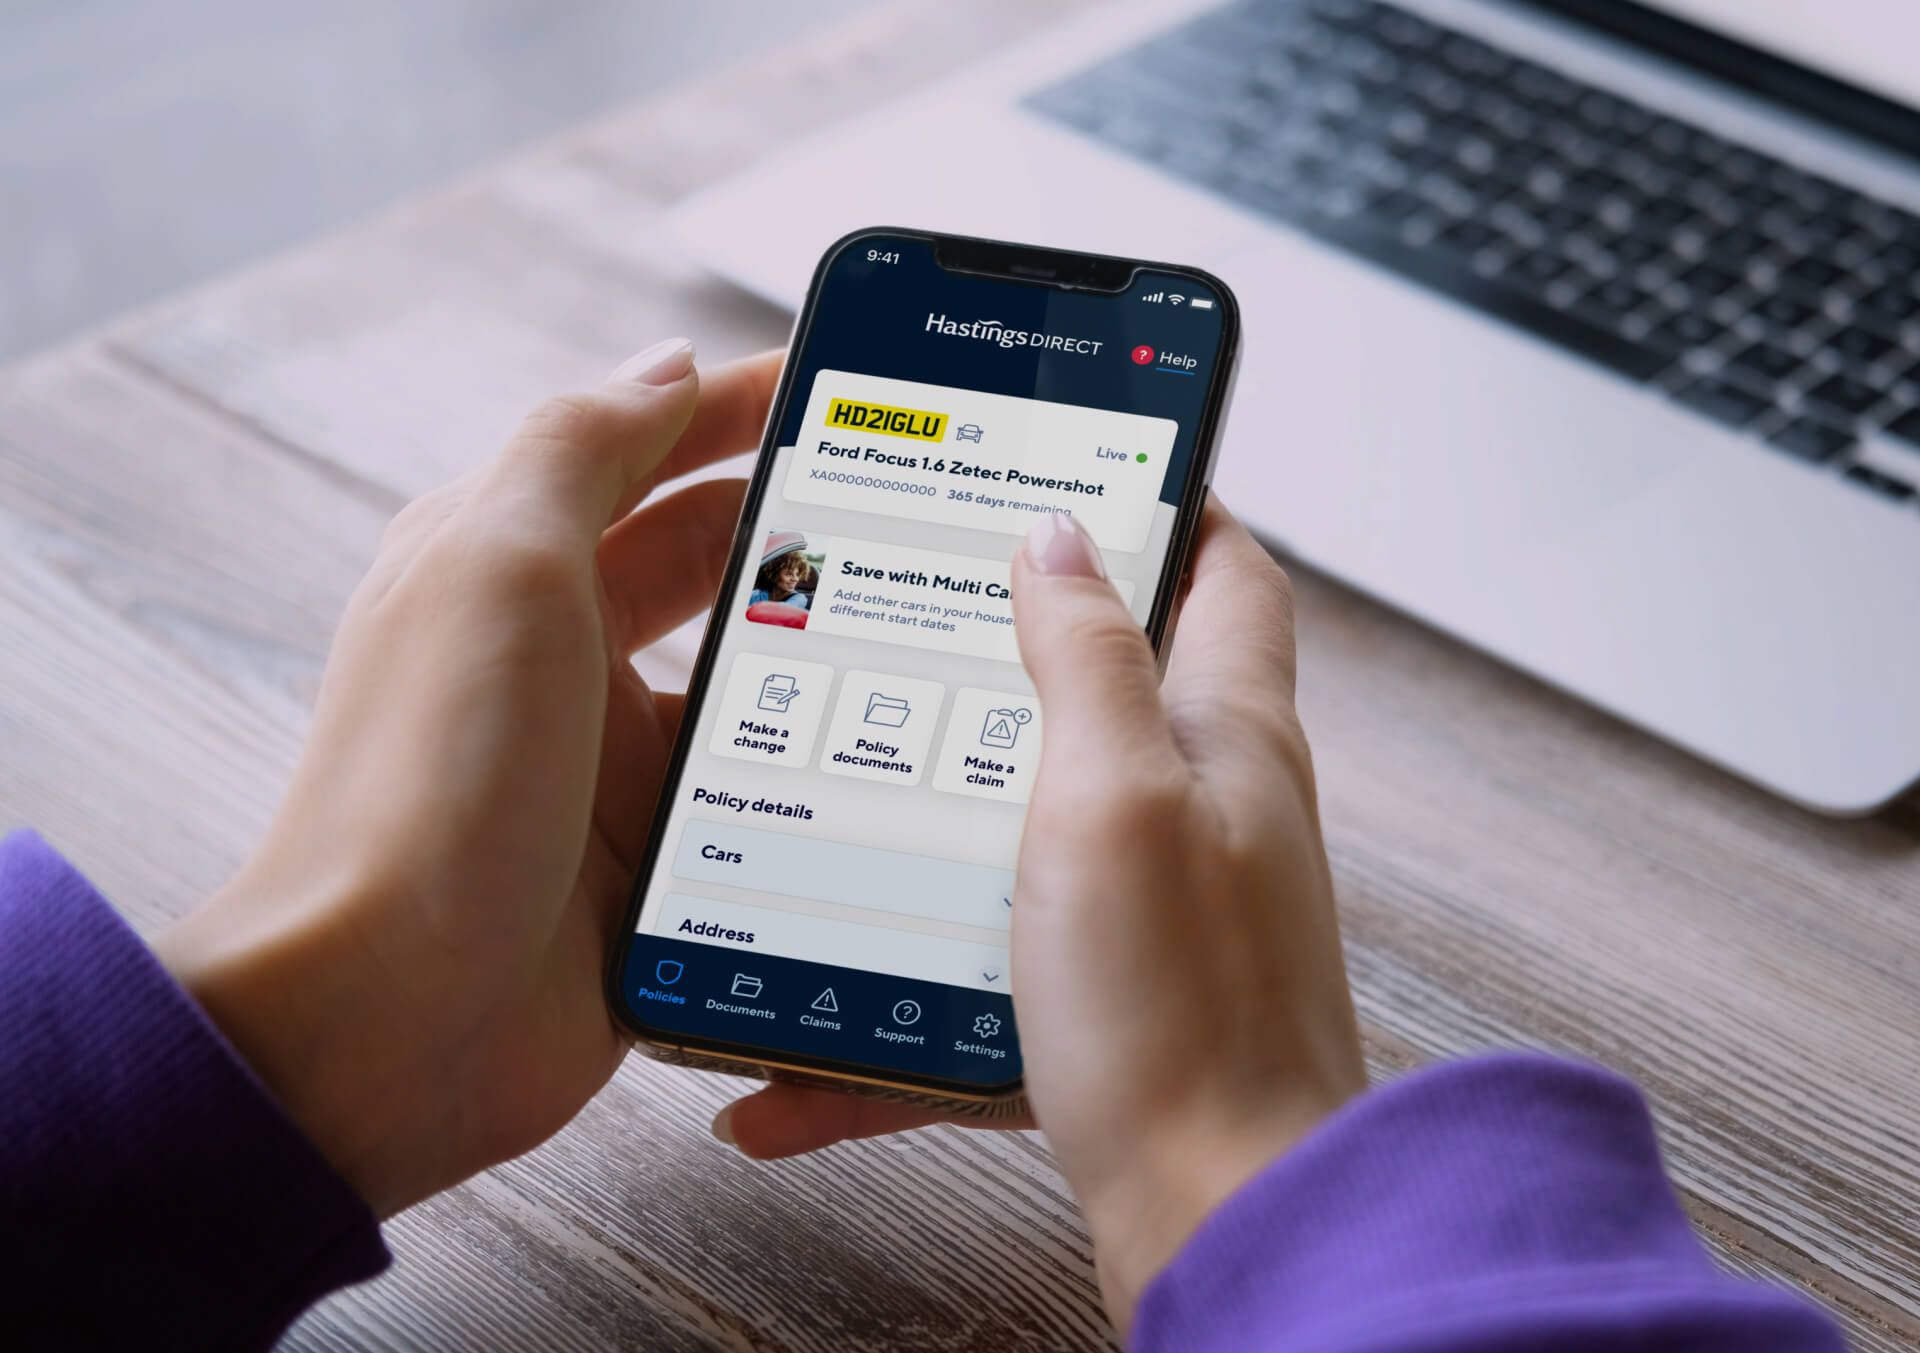
Hastings Direct
Digital transformation for the UK’s biggest digital insurer
- 2.24% conversion rate
- 17.4% adoption rate
- New proposition validated in 90 days
- 2.24% conversion rate
- 17.4% adoption rate
- New proposition validated in 90 days
- 2.24% conversion rate
- 17.4% adoption rate
- New proposition validated in 90 days
- 2.24% conversion rate
- 17.4% adoption rate
- New proposition validated in 90 days
Holland & Barrett
Define, prototype, and validate new propositions
- MoM conversion rate of 6.9%
- LFL quarterly revenue of £265K
- MoM conversion rate of 6.9%
- LFL quarterly revenue of £265K
- MoM conversion rate of 6.9%
- LFL quarterly revenue of £265K
- MoM conversion rate of 6.9%
- LFL quarterly revenue of £265K
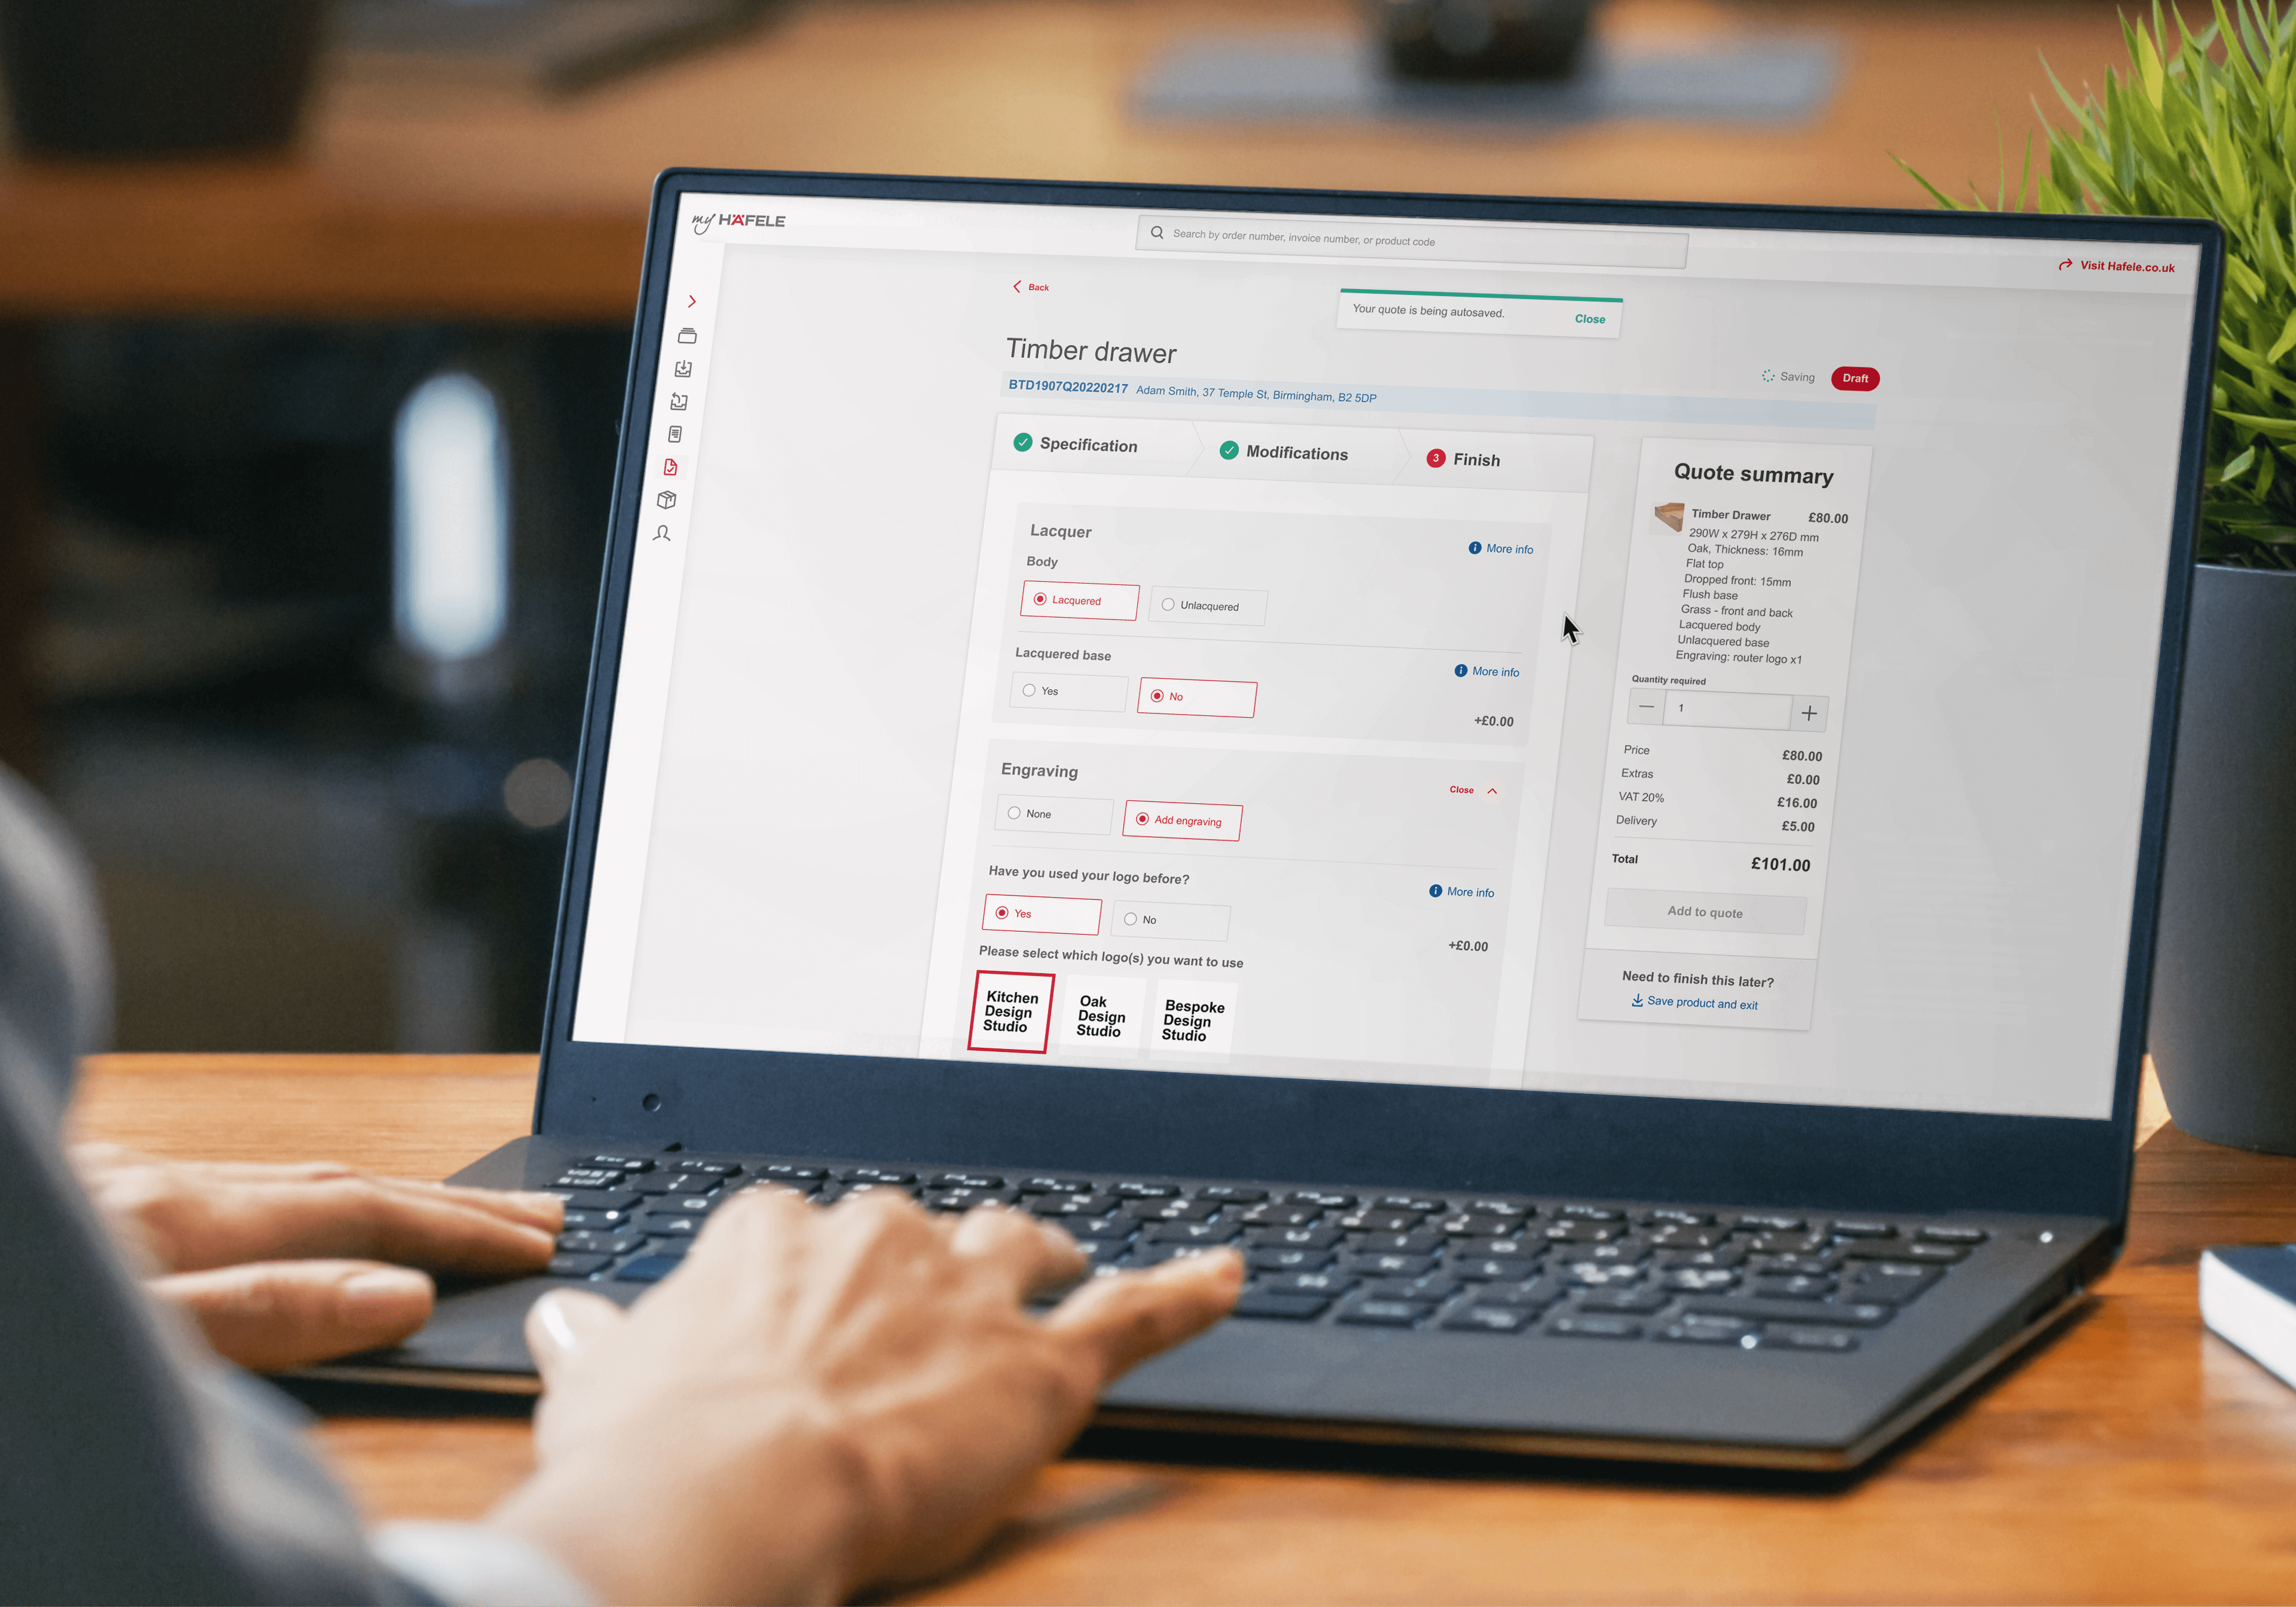
Hafele UK
Future-proofing business strategy through UX, data, and optimisation
- 12 core features tackled
- 186 pains points identified
- 52 user interviews conducted
- 12 core features tackled
- 186 pains points identified
- 52 user interviews conducted
- 12 core features tackled
- 186 pains points identified
- 52 user interviews conducted
- 12 core features tackled
- 186 pains points identified
- 52 user interviews conducted

Eque2
Elevating two core business management platform experiences
- £1m cash-based pilot business in 1 year with 1 branch
- QoQ trade with 2 branches taking as much cash as 14 TP branches
- £1m cash-based pilot business in 1 year with 1 branch
- QoQ trade with 2 branches taking as much cash as 14 TP branches
- £1m cash-based pilot business in 1 year with 1 branch
- QoQ trade with 2 branches taking as much cash as 14 TP branches
- £1m cash-based pilot business in 1 year with 1 branch
- QoQ trade with 2 branches taking as much cash as 14 TP branches
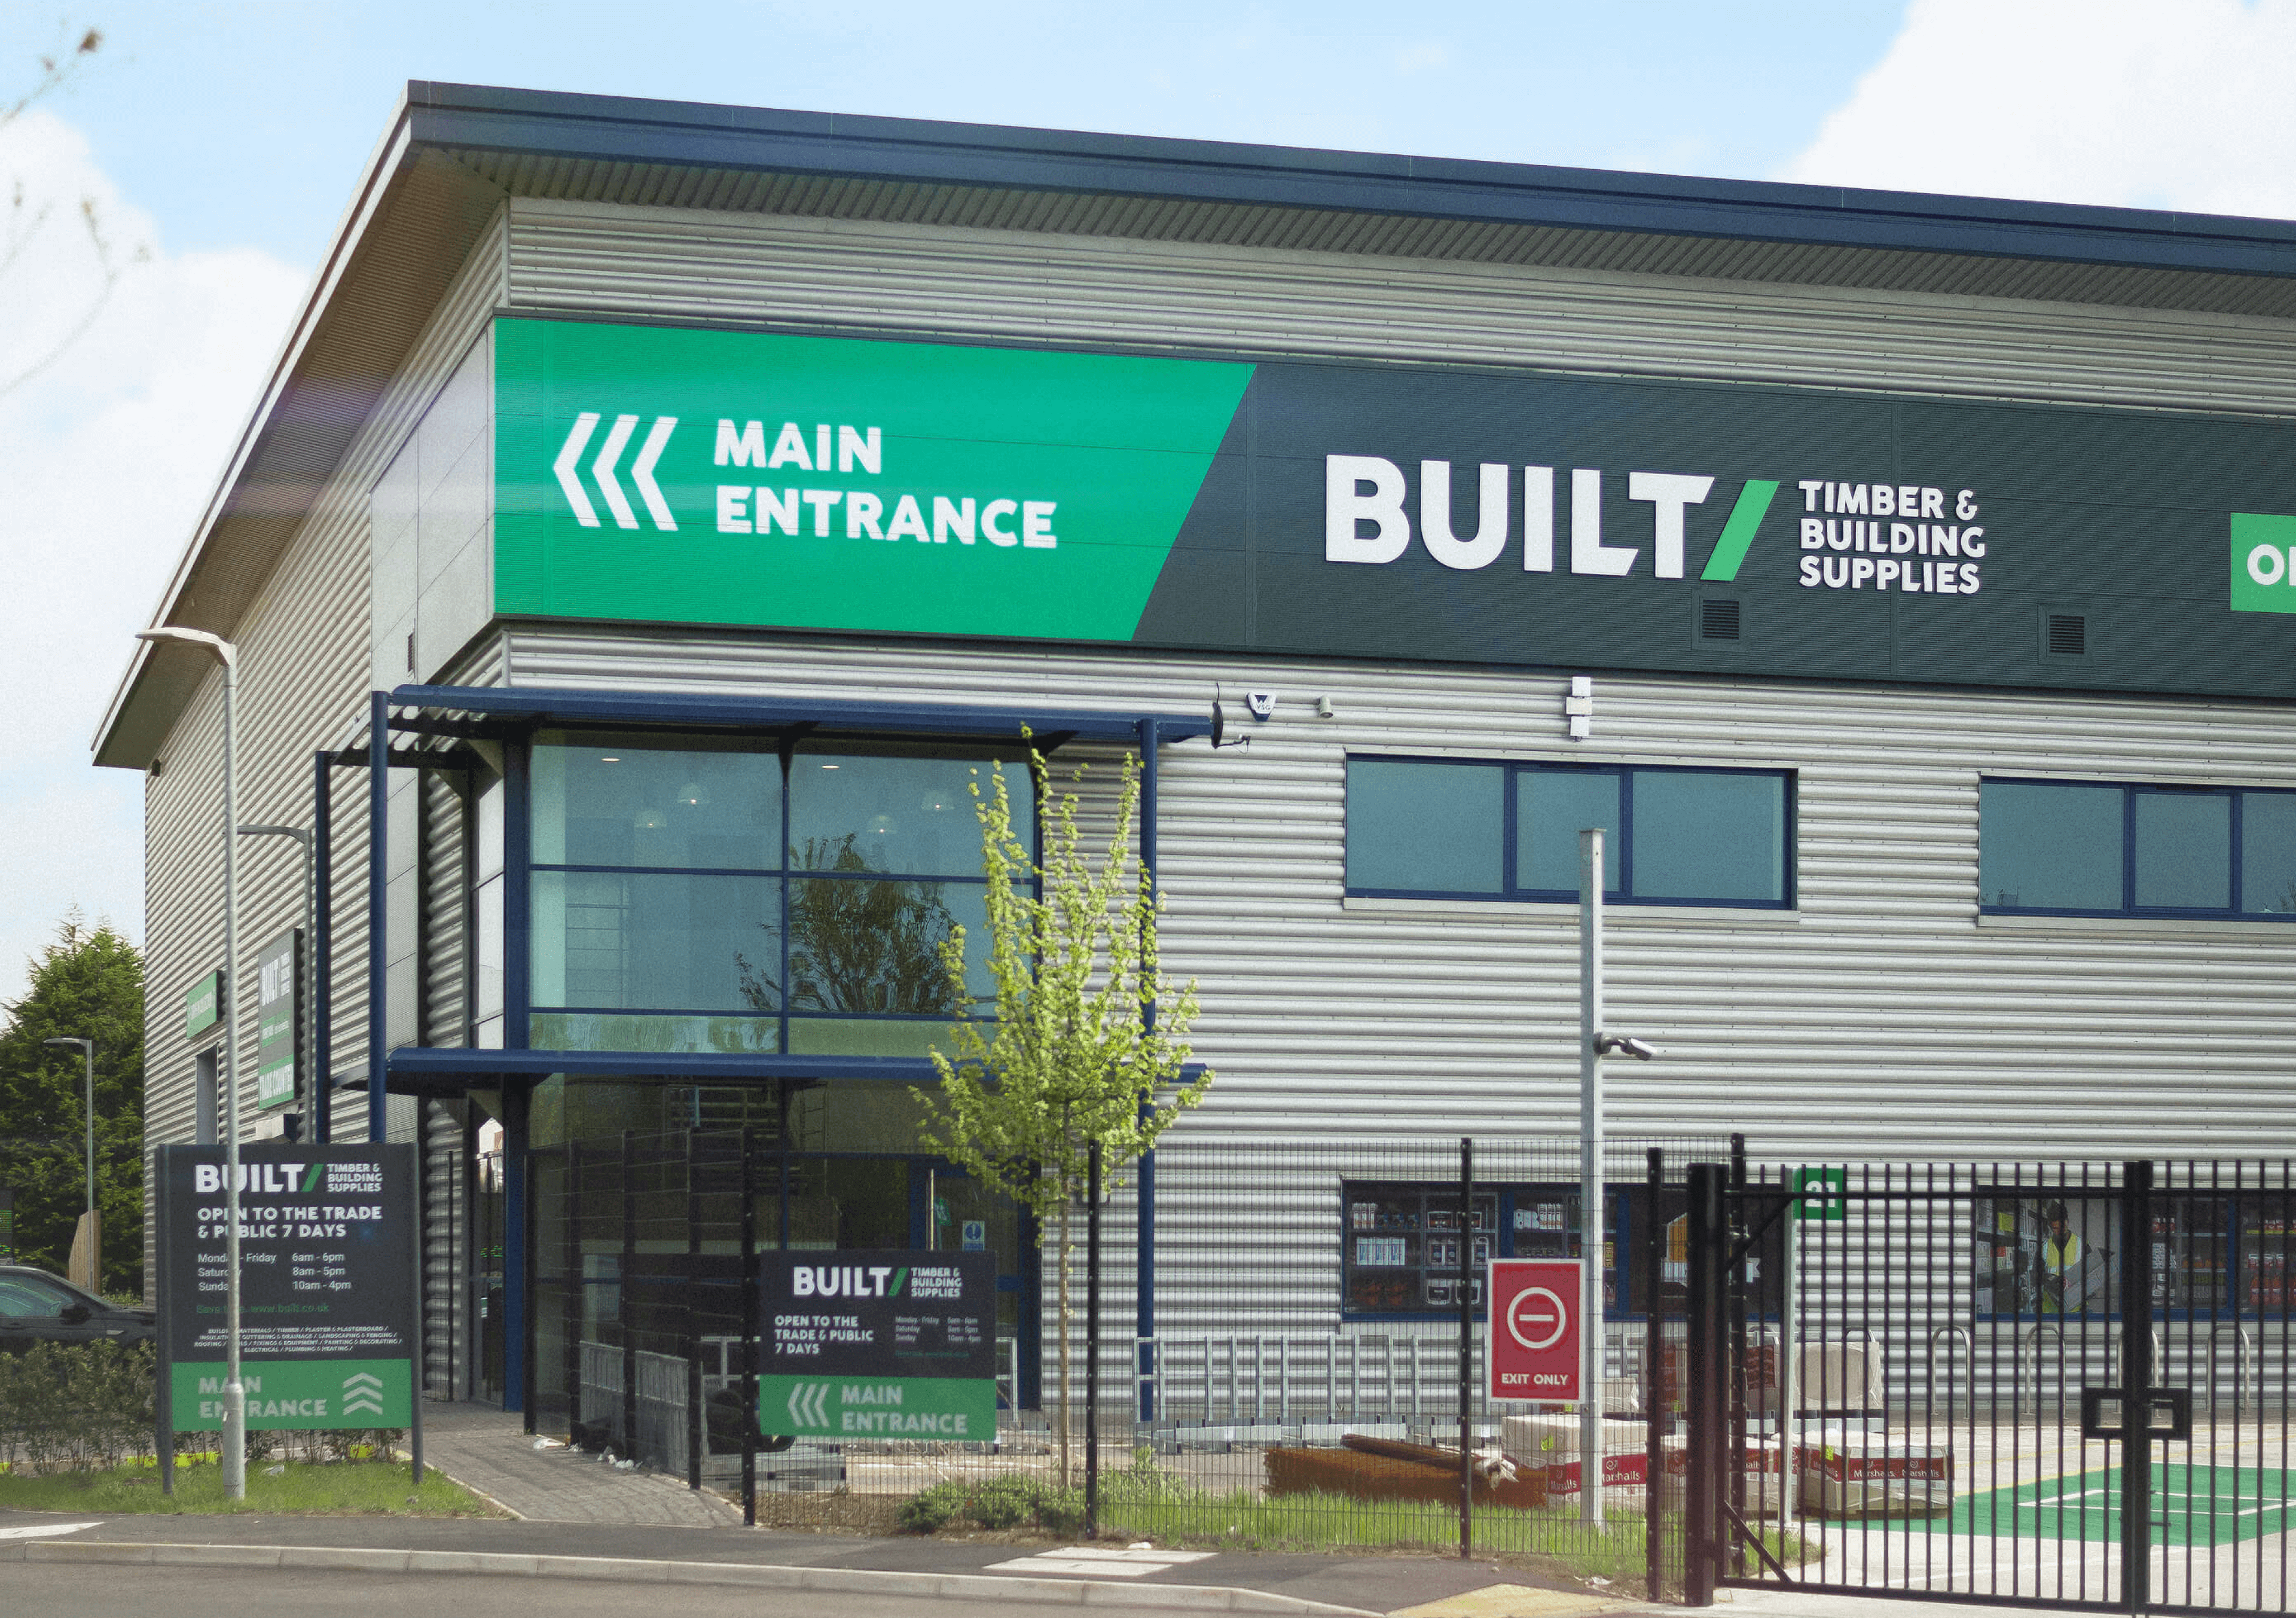
BUILT/
A better builder's warehouse built from the ground up
- Increased conversion rates by 1.62%
- Achieved a 215% in-store adoption uplift
- Delivered in 2 sprints
- Increased conversion rates by 1.62%
- Achieved a 215% in-store adoption uplift
- Delivered in 2 sprints
- Increased conversion rates by 1.62%
- Achieved a 215% in-store adoption uplift
- Delivered in 2 sprints
- Increased conversion rates by 1.62%
- Achieved a 215% in-store adoption uplift
- Delivered in 2 sprints
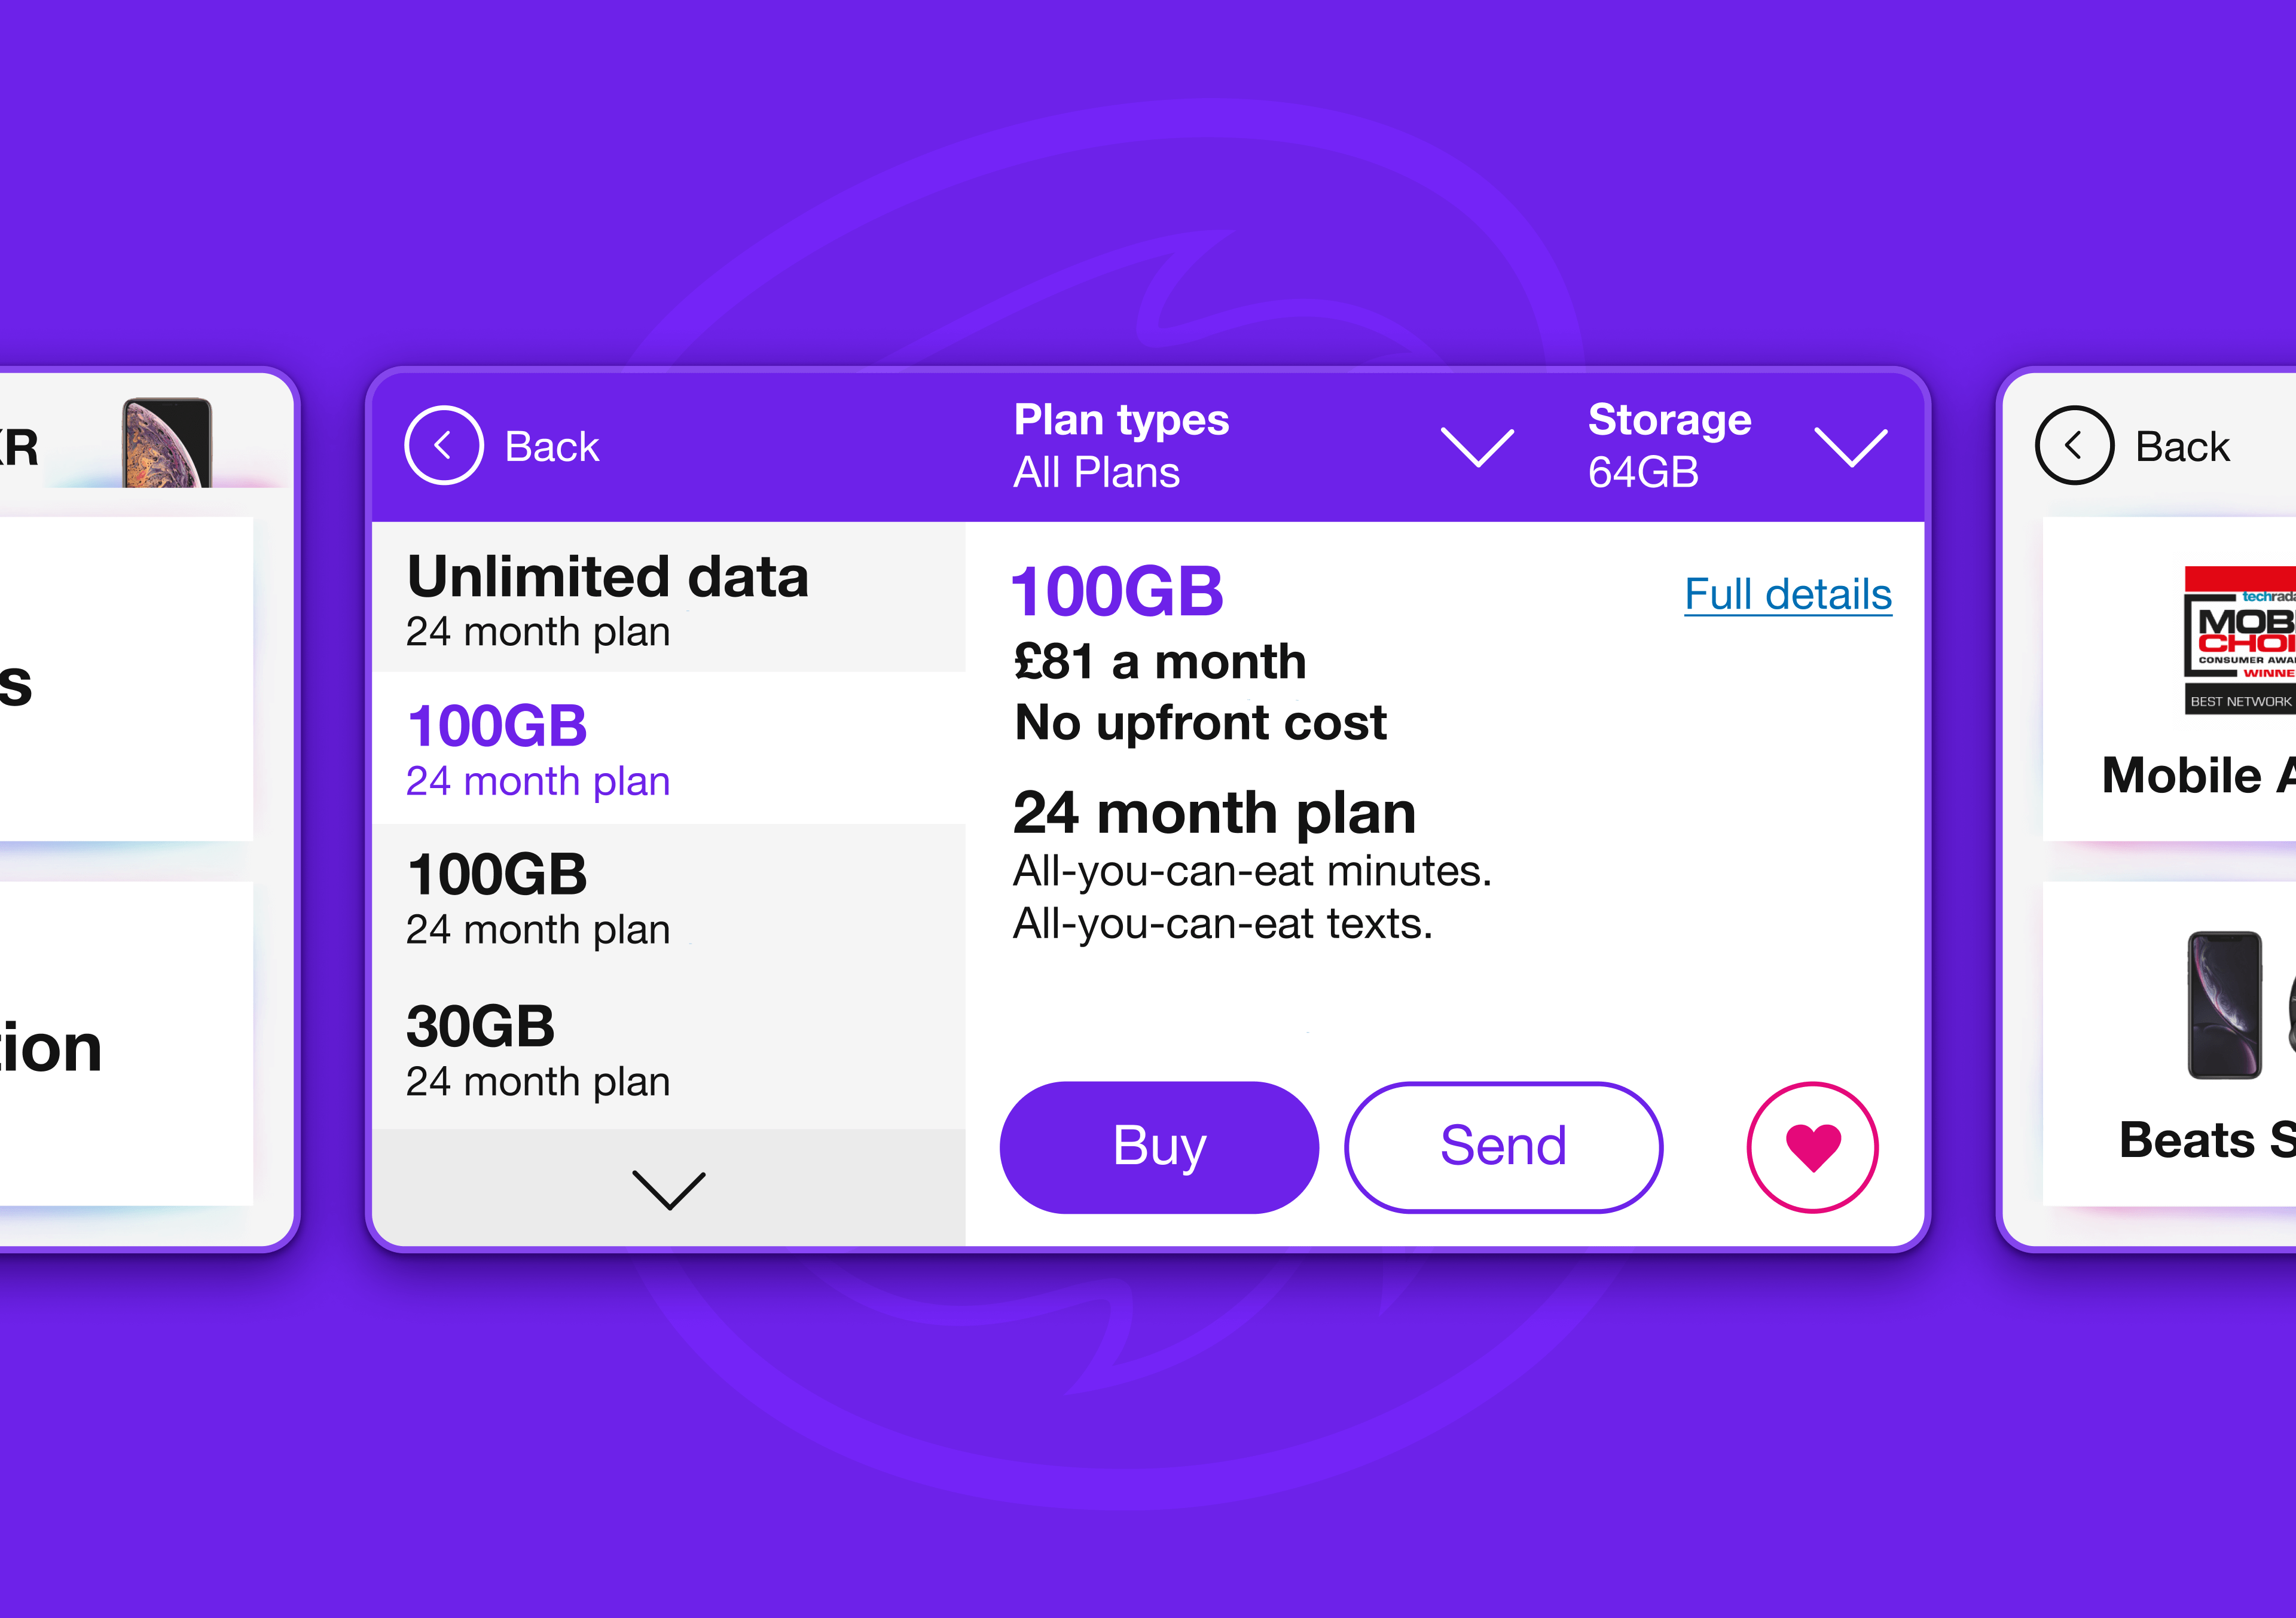
Three
Selling more phone tariffs through digital
- Growing worldwide market share by 27.3%
- Achieving user growth of 1.1m in 6-months
- 37 critical UX recommendations identified
- Growing worldwide market share by 27.3%
- Achieving user growth of 1.1m in 6-months
- 37 critical UX recommendations identified
- Growing worldwide market share by 27.3%
- Achieving user growth of 1.1m in 6-months
- 37 critical UX recommendations identified
- Growing worldwide market share by 27.3%
- Achieving user growth of 1.1m in 6-months
- 37 critical UX recommendations identified
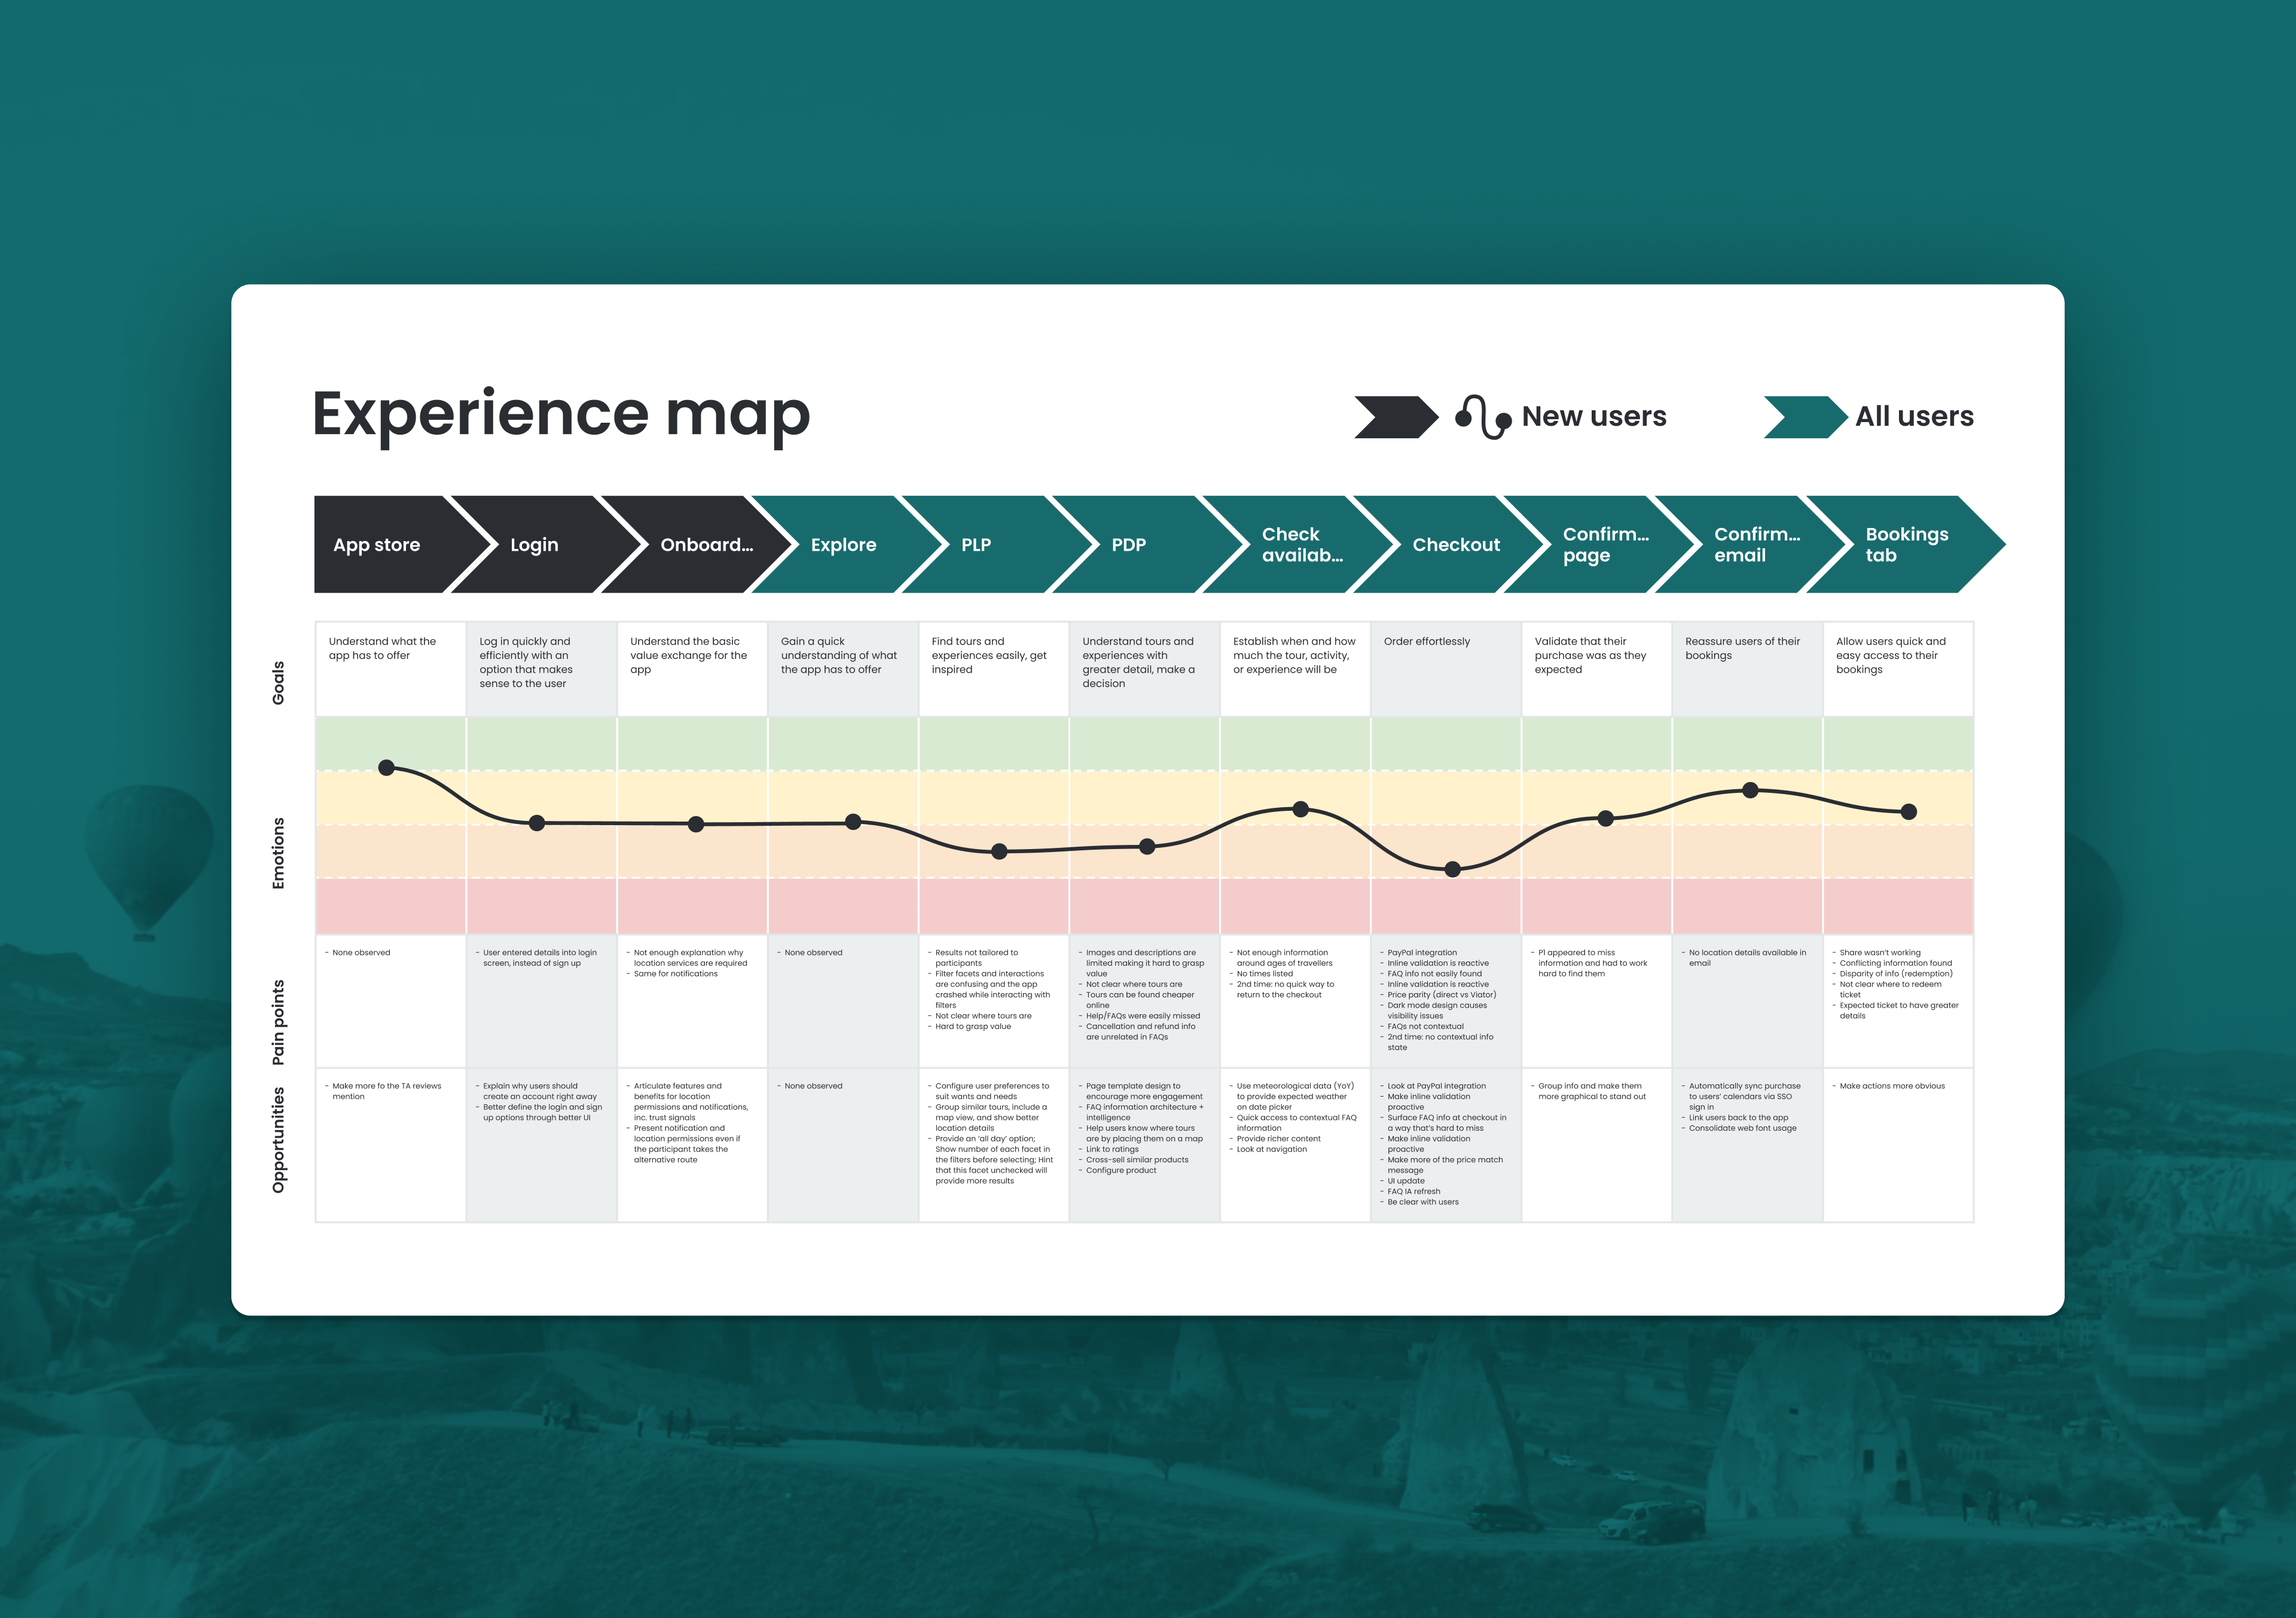
Viator
Research and validation for a leading travel app
- 15-days turnaround
- 29 screens designed
- Validated 2 prototypes with 12 participants
- 15-days turnaround
- 29 screens designed
- Validated 2 prototypes with 12 participants
- 15-days turnaround
- 29 screens designed
- Validated 2 prototypes with 12 participants
- 15-days turnaround
- 29 screens designed
- Validated 2 prototypes with 12 participants
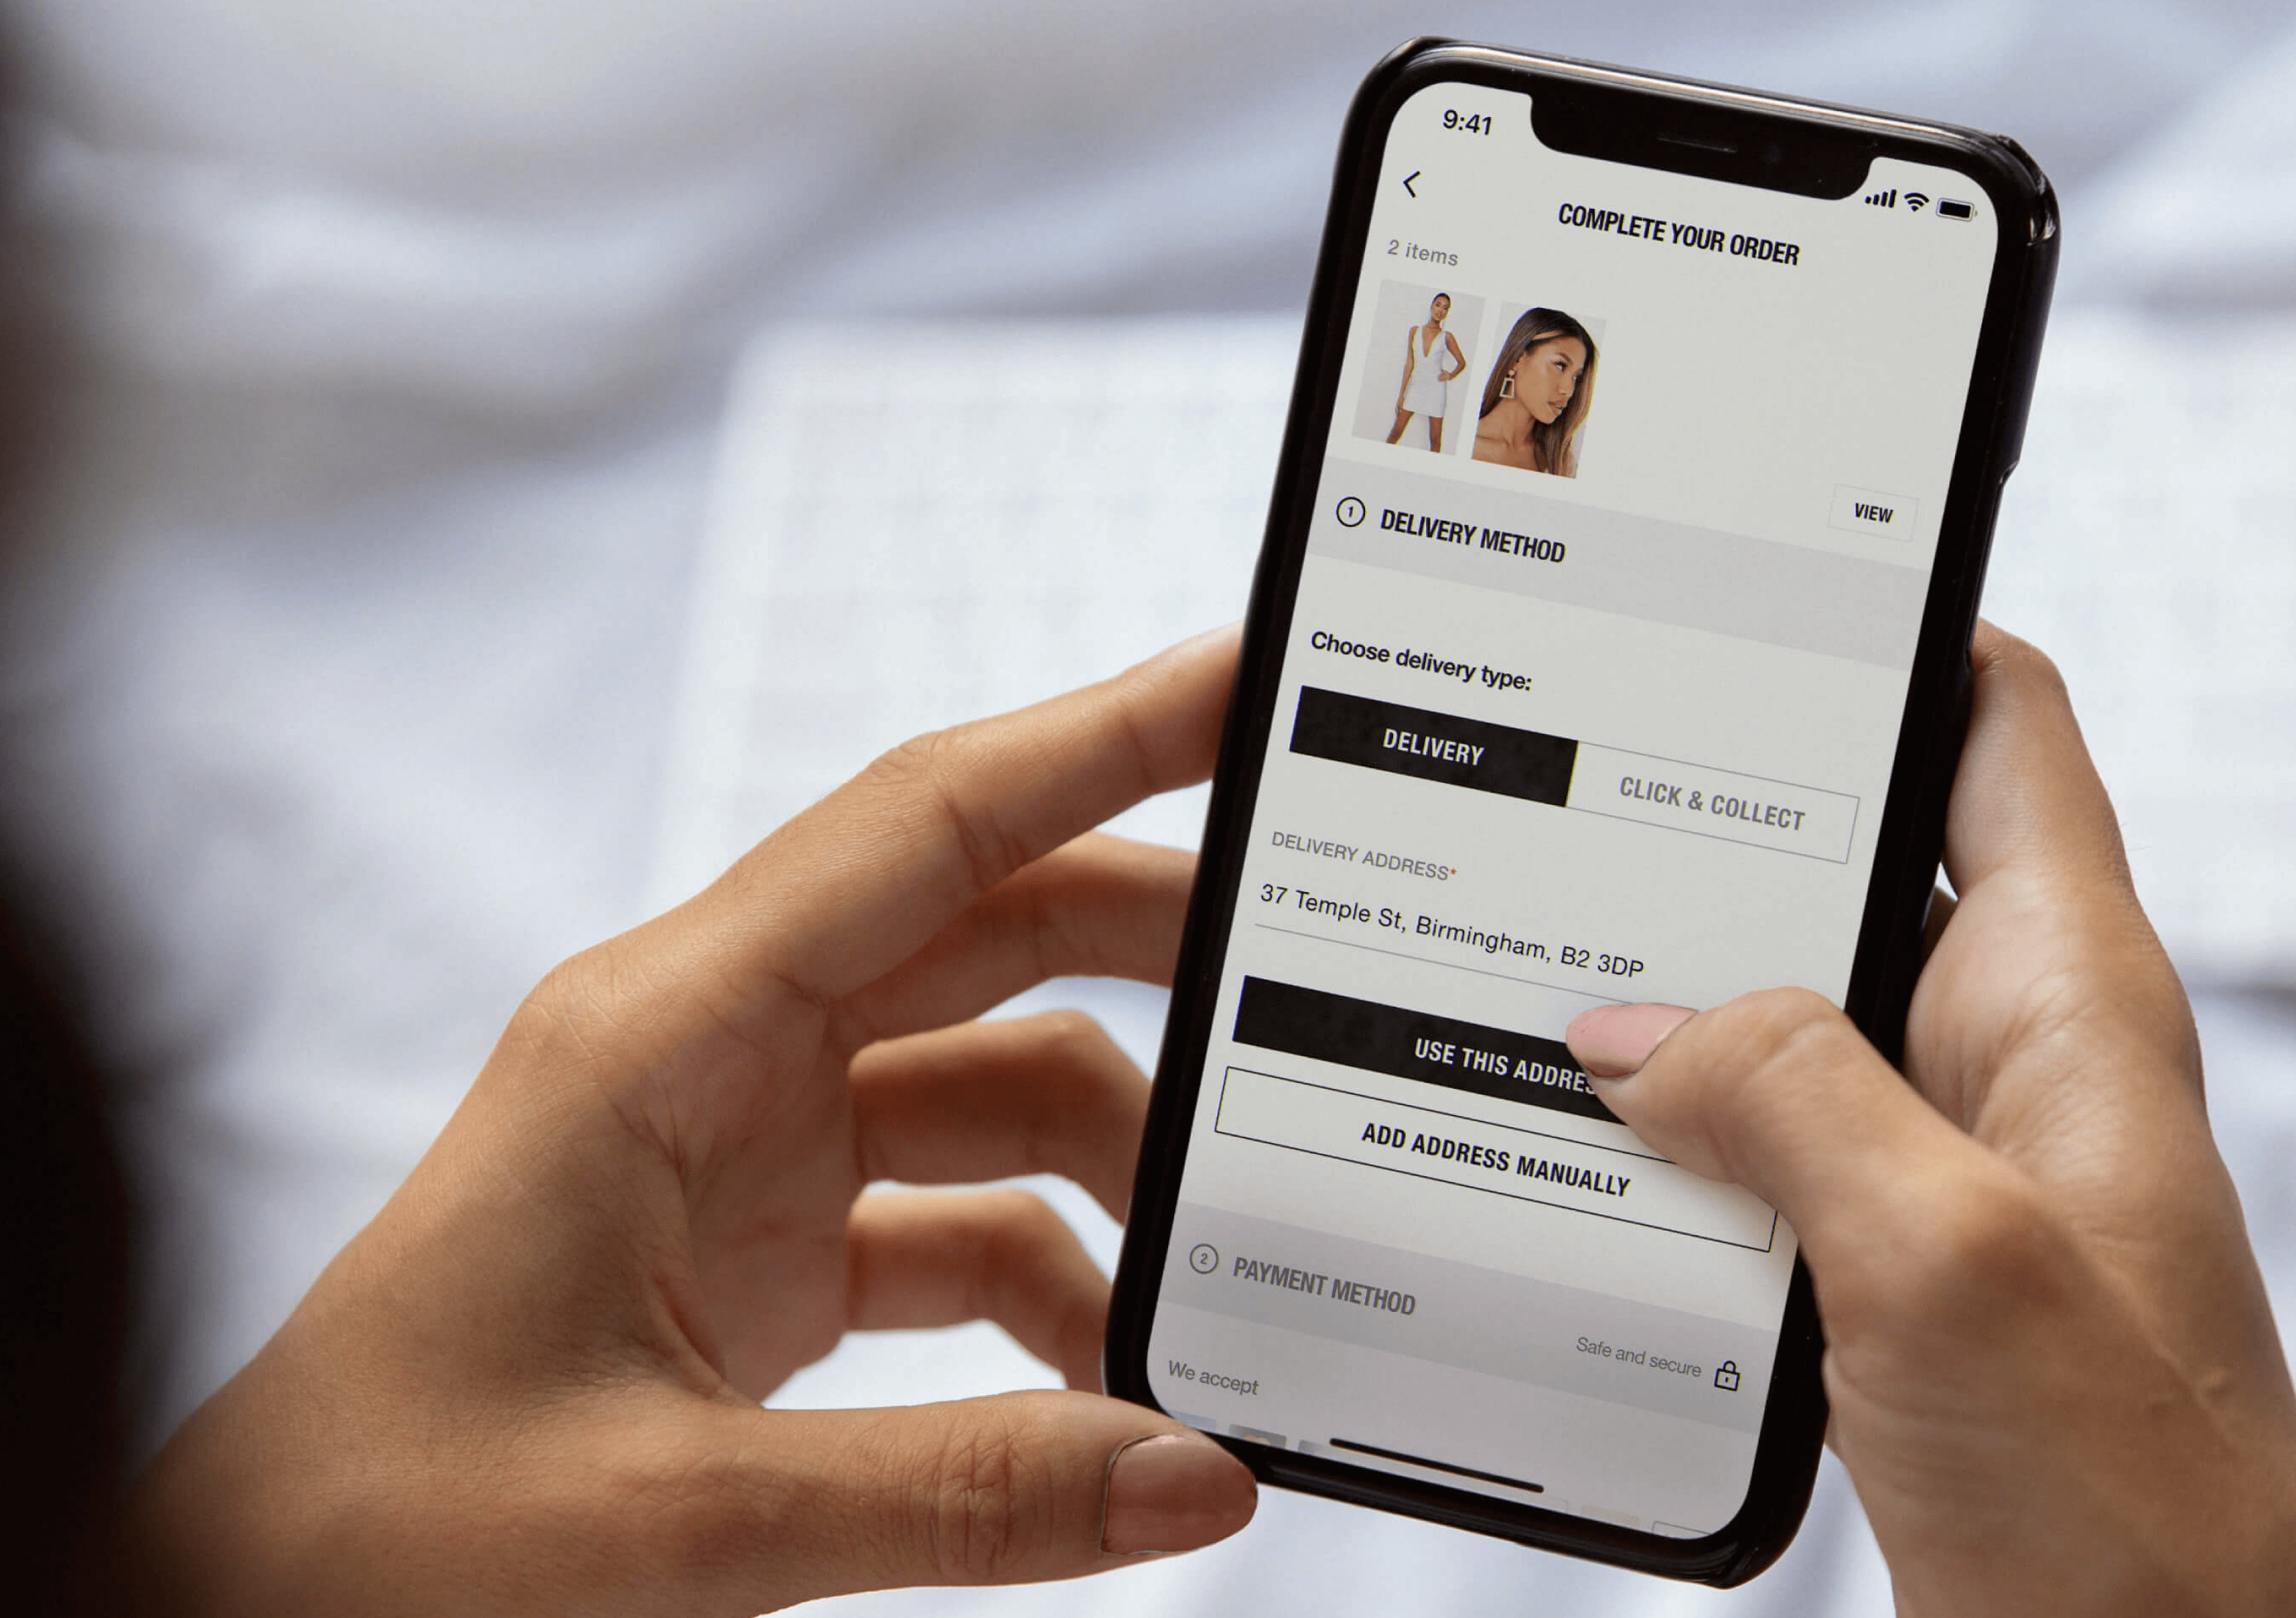
Missguided
App checkout design and validation at speed
- 4% channel revenue share for 9 consecutive months
- YoY growth performance
- 36% LFL, 37% LFL and 30% LFL growth
- 4% channel revenue share for 9 consecutive months
- YoY growth performance
- 36% LFL, 37% LFL and 30% LFL growth
- 4% channel revenue share for 9 consecutive months
- YoY growth performance
- 36% LFL, 37% LFL and 30% LFL growth
- 4% channel revenue share for 9 consecutive months
- YoY growth performance
- 36% LFL, 37% LFL and 30% LFL growth
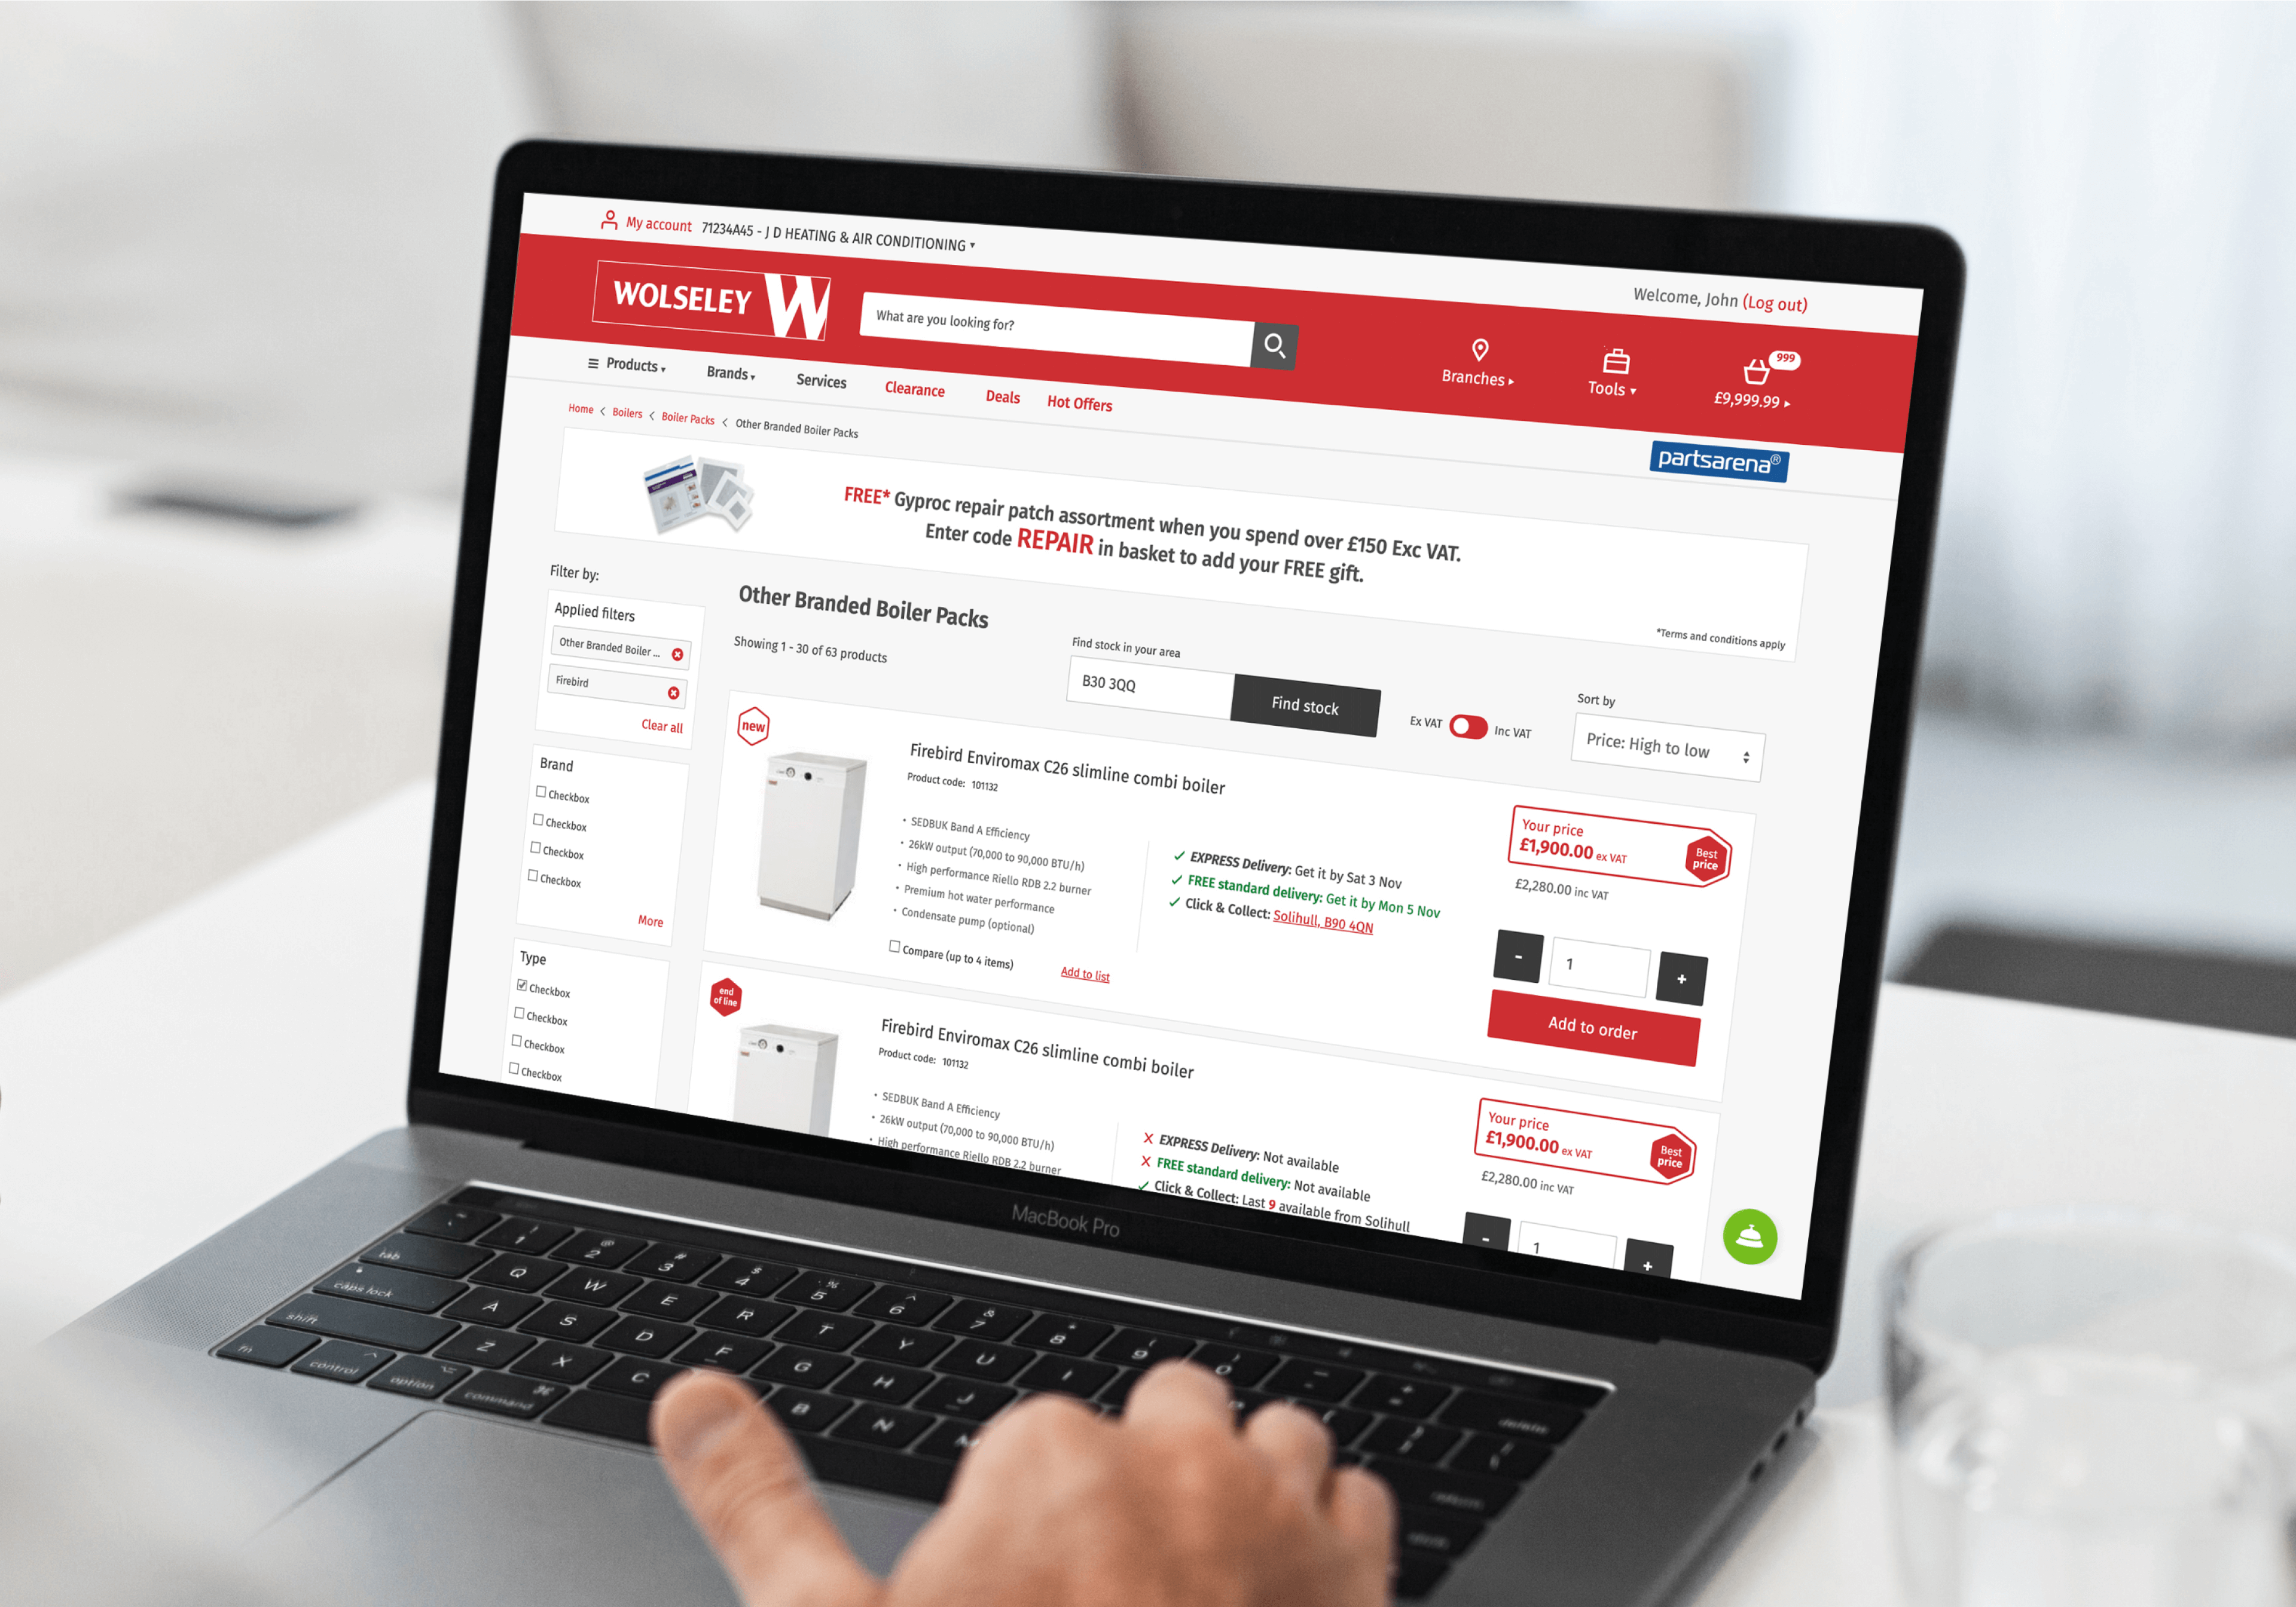
Wolseley UK
Progressive thinking for a digital future
- 41 experiment candidates identified
- 128 events IDs created for tracking
- Delivered in 2-weeks
- 41 experiment candidates identified
- 128 events IDs created for tracking
- Delivered in 2-weeks
- 41 experiment candidates identified
- 128 events IDs created for tracking
- Delivered in 2-weeks
- 41 experiment candidates identified
- 128 events IDs created for tracking
- Delivered in 2-weeks
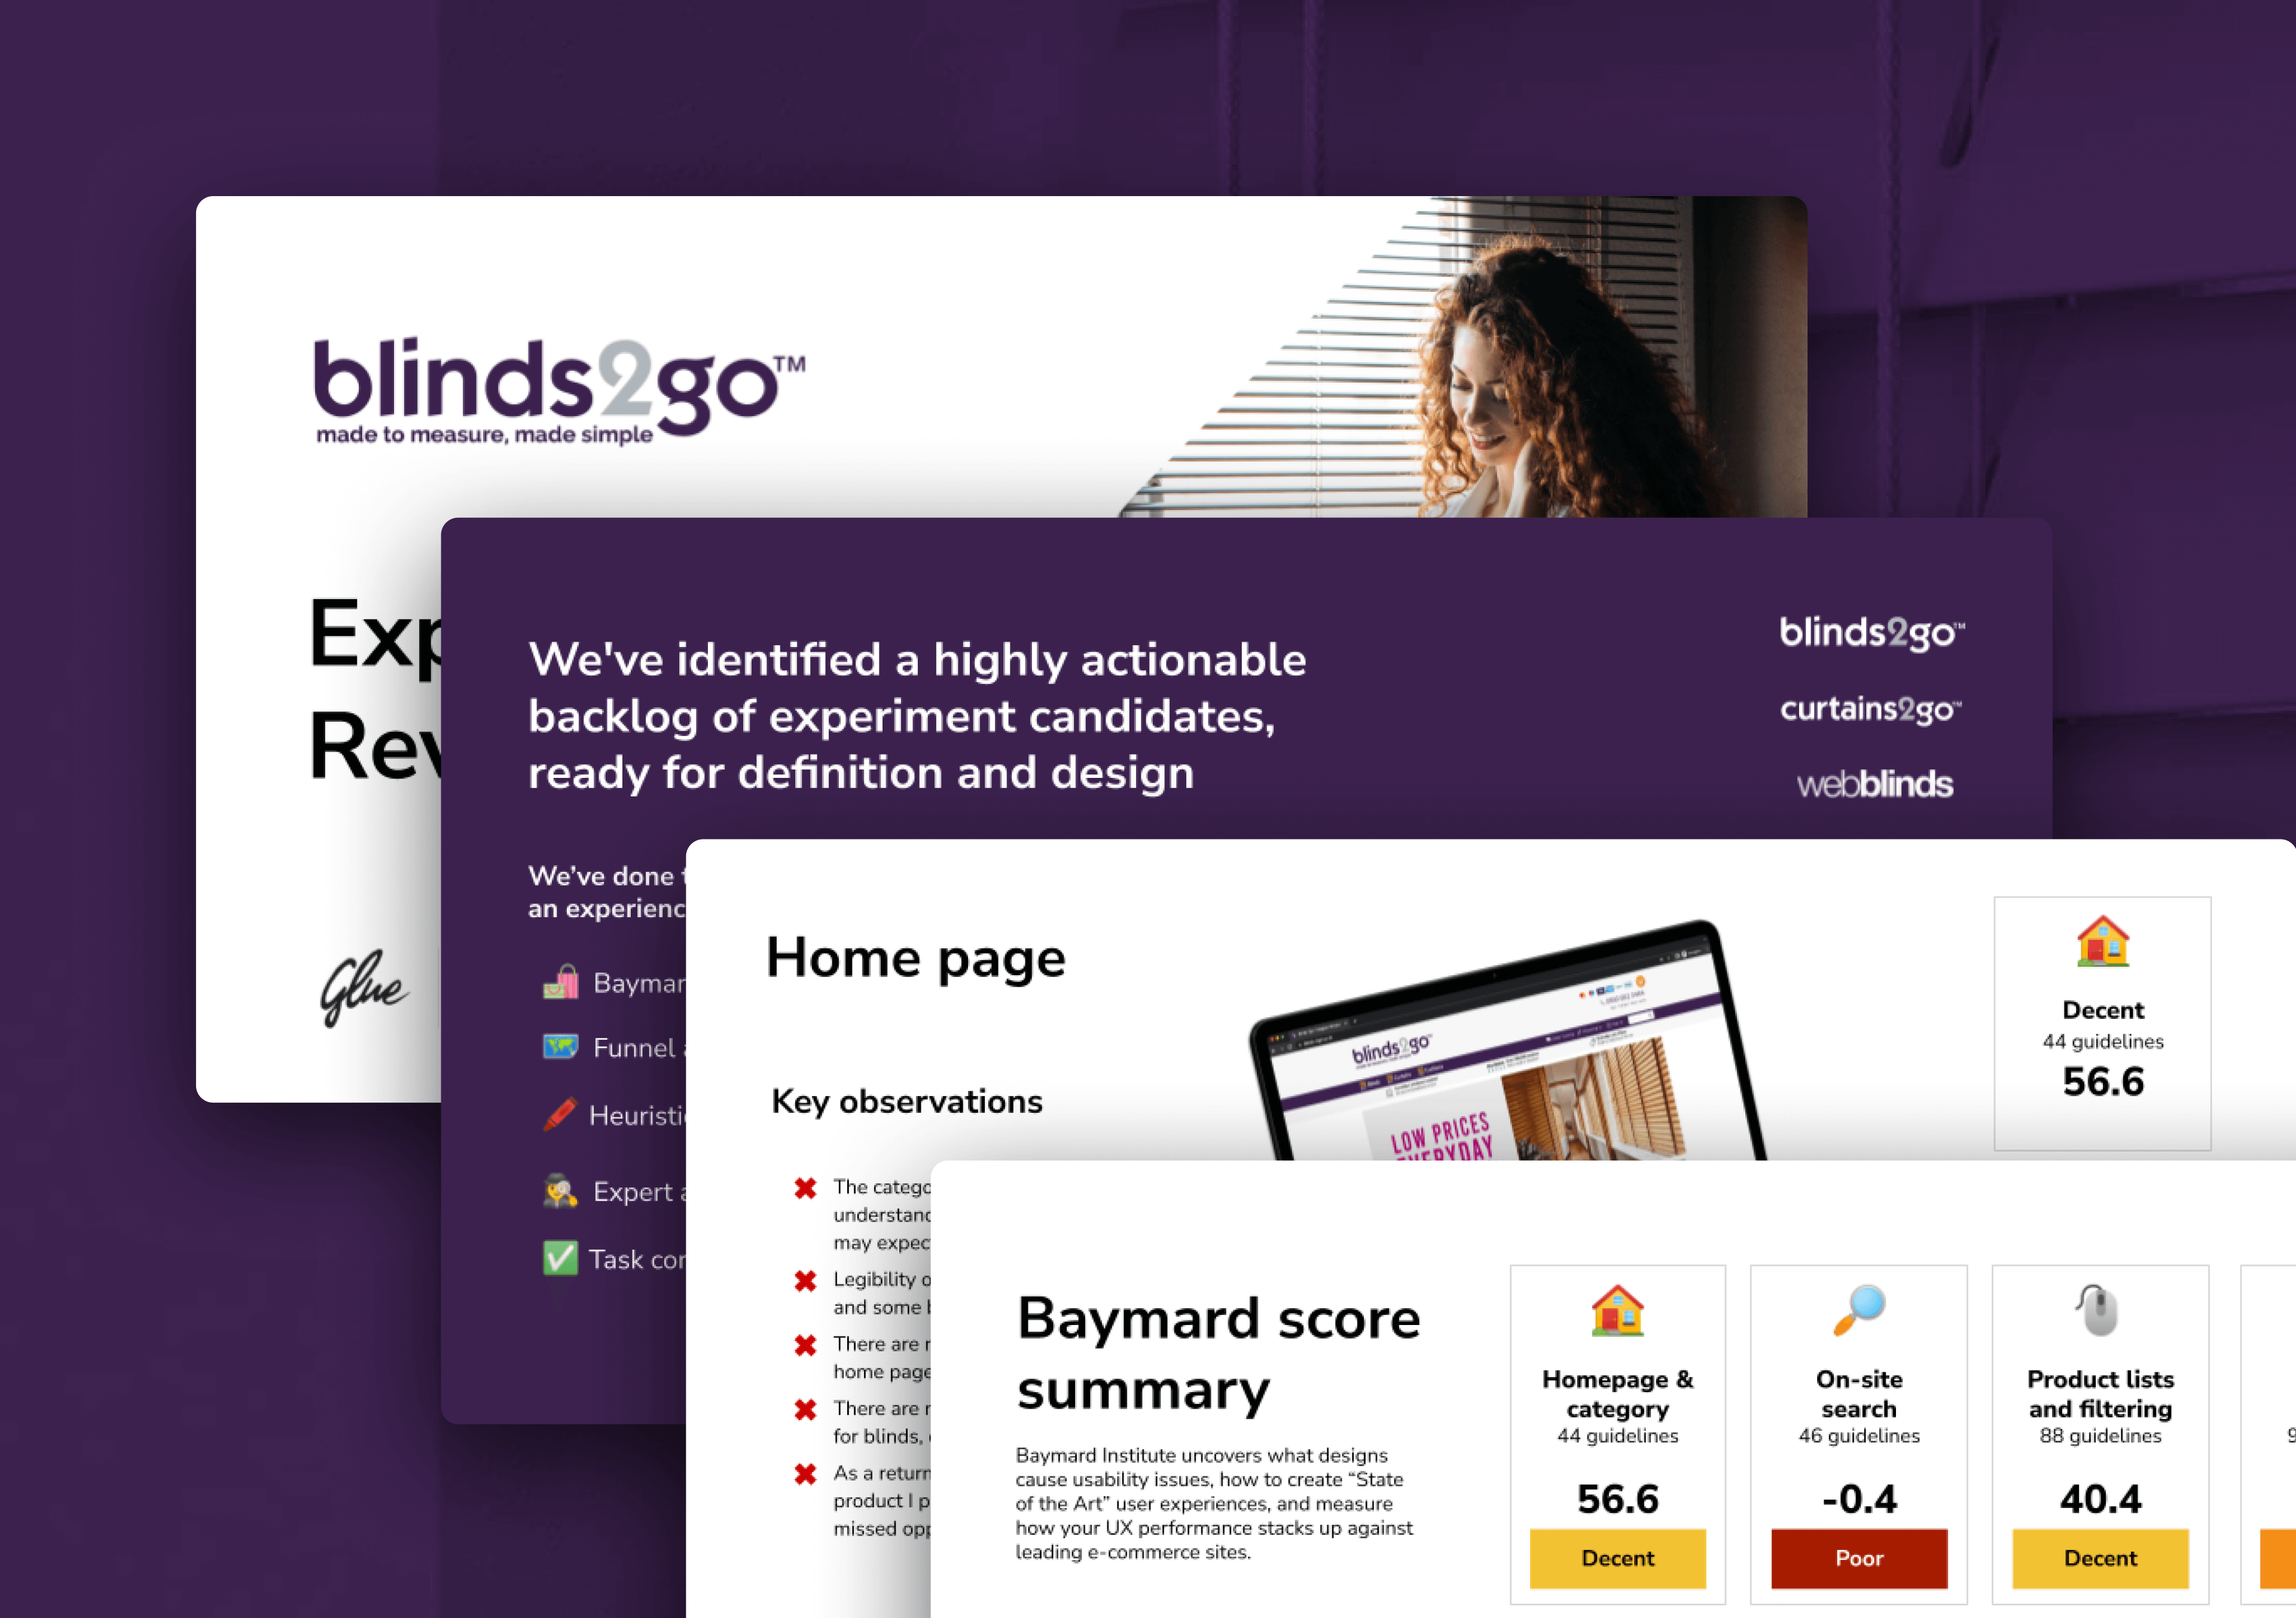
Blinds2Go
Experiment backlog identification
- 41 defects uncovered
- 14 opportunities identified
- Delivered in 1 sprint
- 41 defects uncovered
- 14 opportunities identified
- Delivered in 1 sprint
- 41 defects uncovered
- 14 opportunities identified
- Delivered in 1 sprint
- 41 defects uncovered
- 14 opportunities identified
- Delivered in 1 sprint
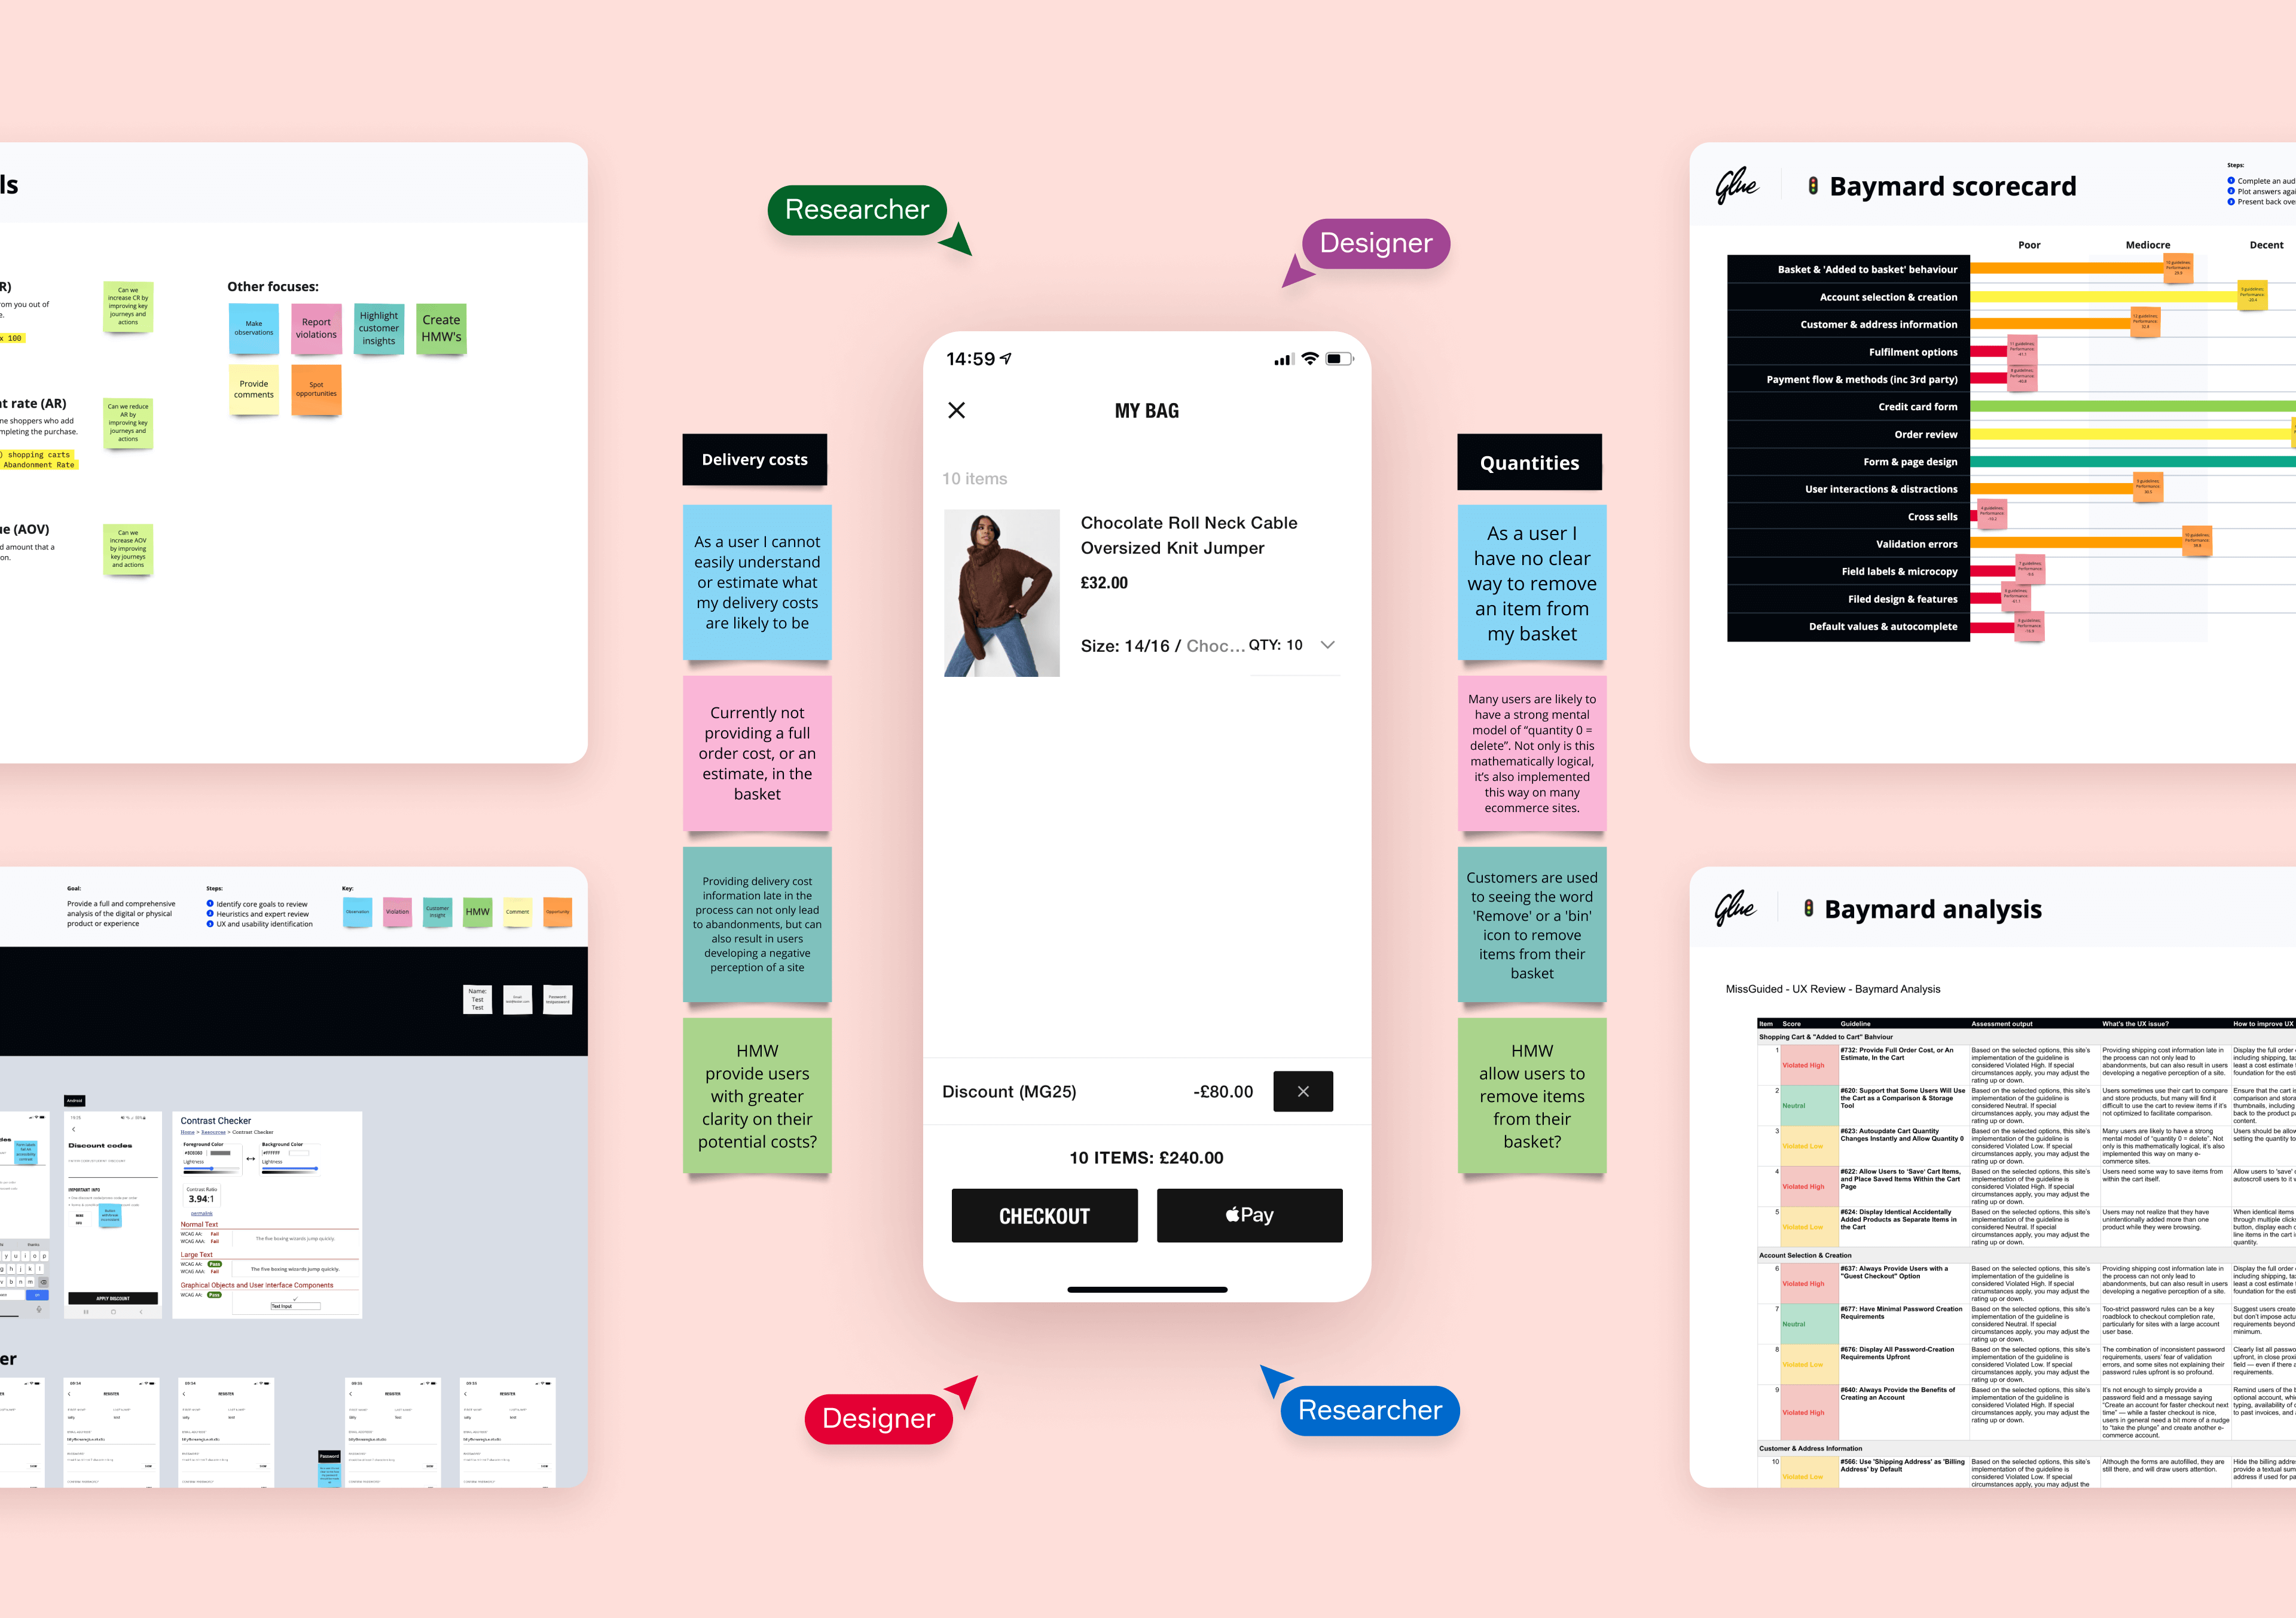
Missguided
Qualifying a product backlog for action
- Fully qualified backlog realised
- 153 trends identified
- Conducted across a 10-day sprint
- Fully qualified backlog realised
- 153 trends identified
- Conducted across a 10-day sprint
- Fully qualified backlog realised
- 153 trends identified
- Conducted across a 10-day sprint
- Fully qualified backlog realised
- 153 trends identified
- Conducted across a 10-day sprint

Wapp
Setting out future innovation for growth
- 1-month to deliver
- Built for optimisation
- 1-month to deliver
- Built for optimisation
- 1-month to deliver
- Built for optimisation
- 1-month to deliver
- Built for optimisation

Hastings Direct
Delivering a scalable digital design system
- 2.3% in-store conversion rate increase
- 31 screens designed and delivered
- Delivered in 2 sprints
- 2.3% in-store conversion rate increase
- 31 screens designed and delivered
- Delivered in 2 sprints
- 2.3% in-store conversion rate increase
- 31 screens designed and delivered
- Delivered in 2 sprints
- 2.3% in-store conversion rate increase
- 31 screens designed and delivered
- Delivered in 2 sprints
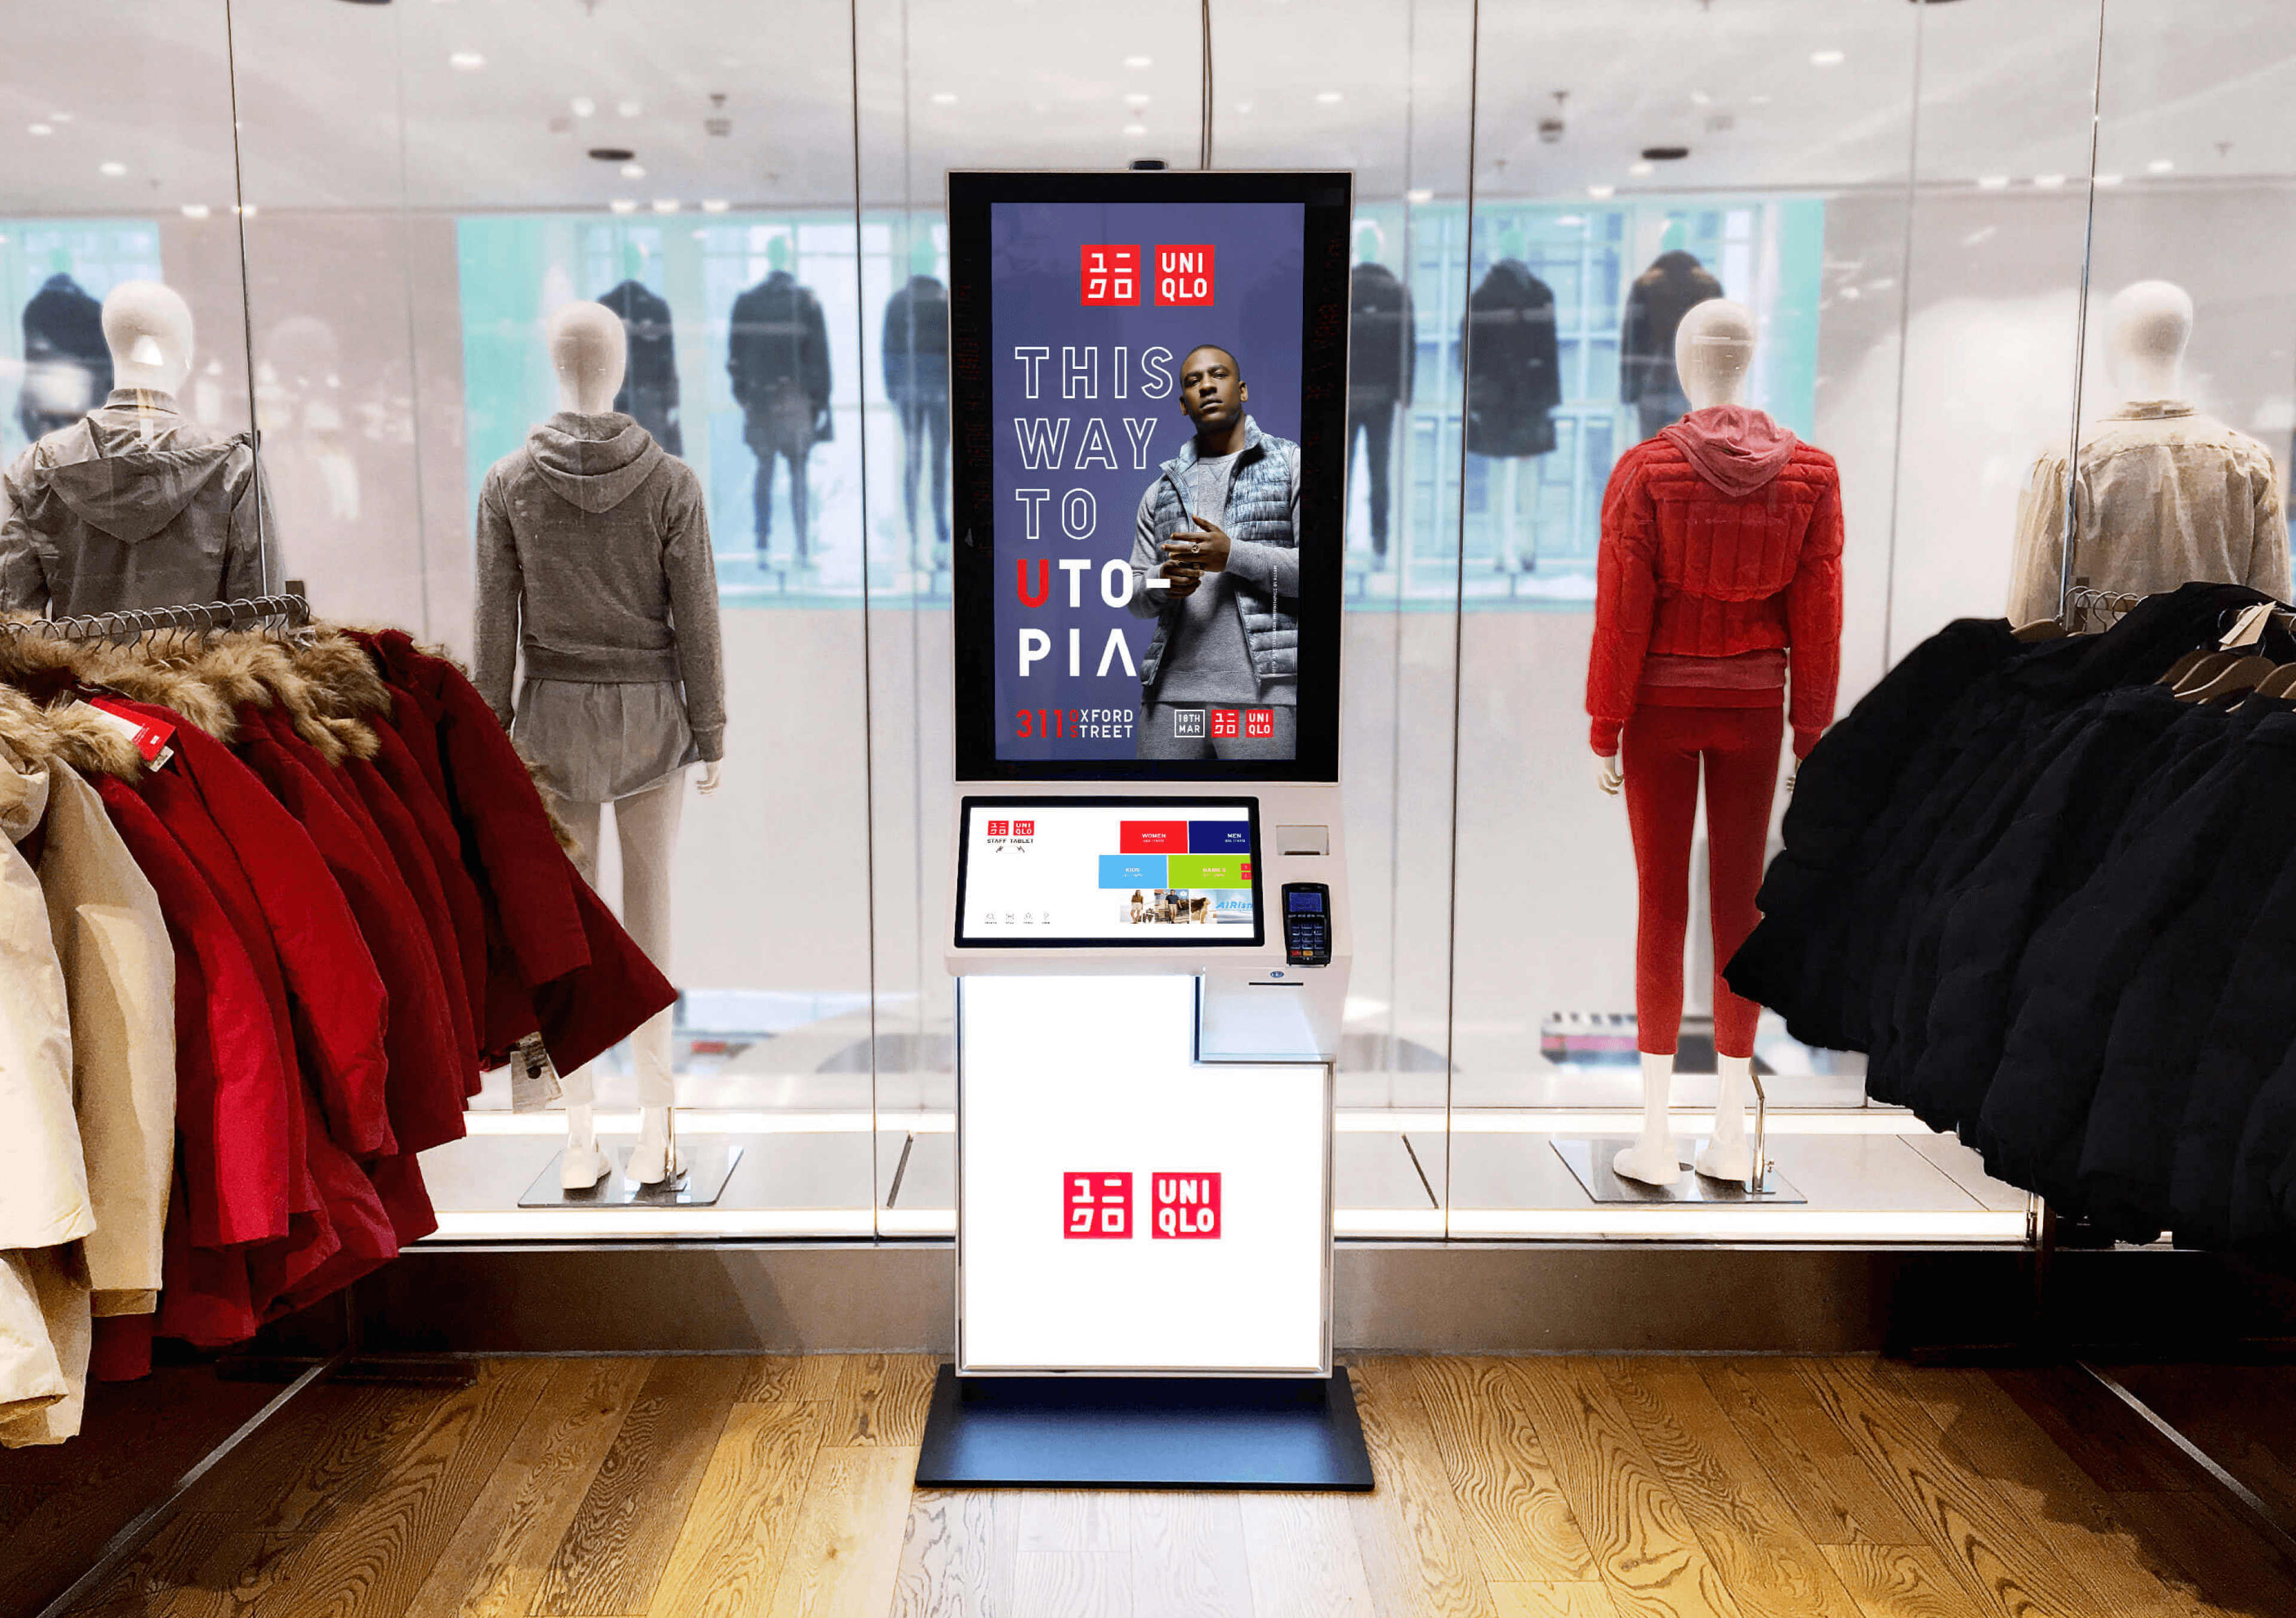
Uniqlo
Making kiosks the go-to tool for shoppers
- Validated with 947 participants
- 8 quantitative and qualitative methods
- 59 core journey changes recommended
- Validated with 947 participants
- 8 quantitative and qualitative methods
- 59 core journey changes recommended
- Validated with 947 participants
- 8 quantitative and qualitative methods
- 59 core journey changes recommended
- Validated with 947 participants
- 8 quantitative and qualitative methods
- 59 core journey changes recommended

Hastings Direct
Making a telephony proposition digital
- Design system for 20+ touchpoints
- 38 scalable icons with responsive variables
- 40% reduction in design time for new features
- Design system for 20+ touchpoints
- 38 scalable icons with responsive variables
- 40% reduction in design time for new features
- Design system for 20+ touchpoints
- 38 scalable icons with responsive variables
- 40% reduction in design time for new features
- Design system for 20+ touchpoints
- 38 scalable icons with responsive variables
- 40% reduction in design time for new features
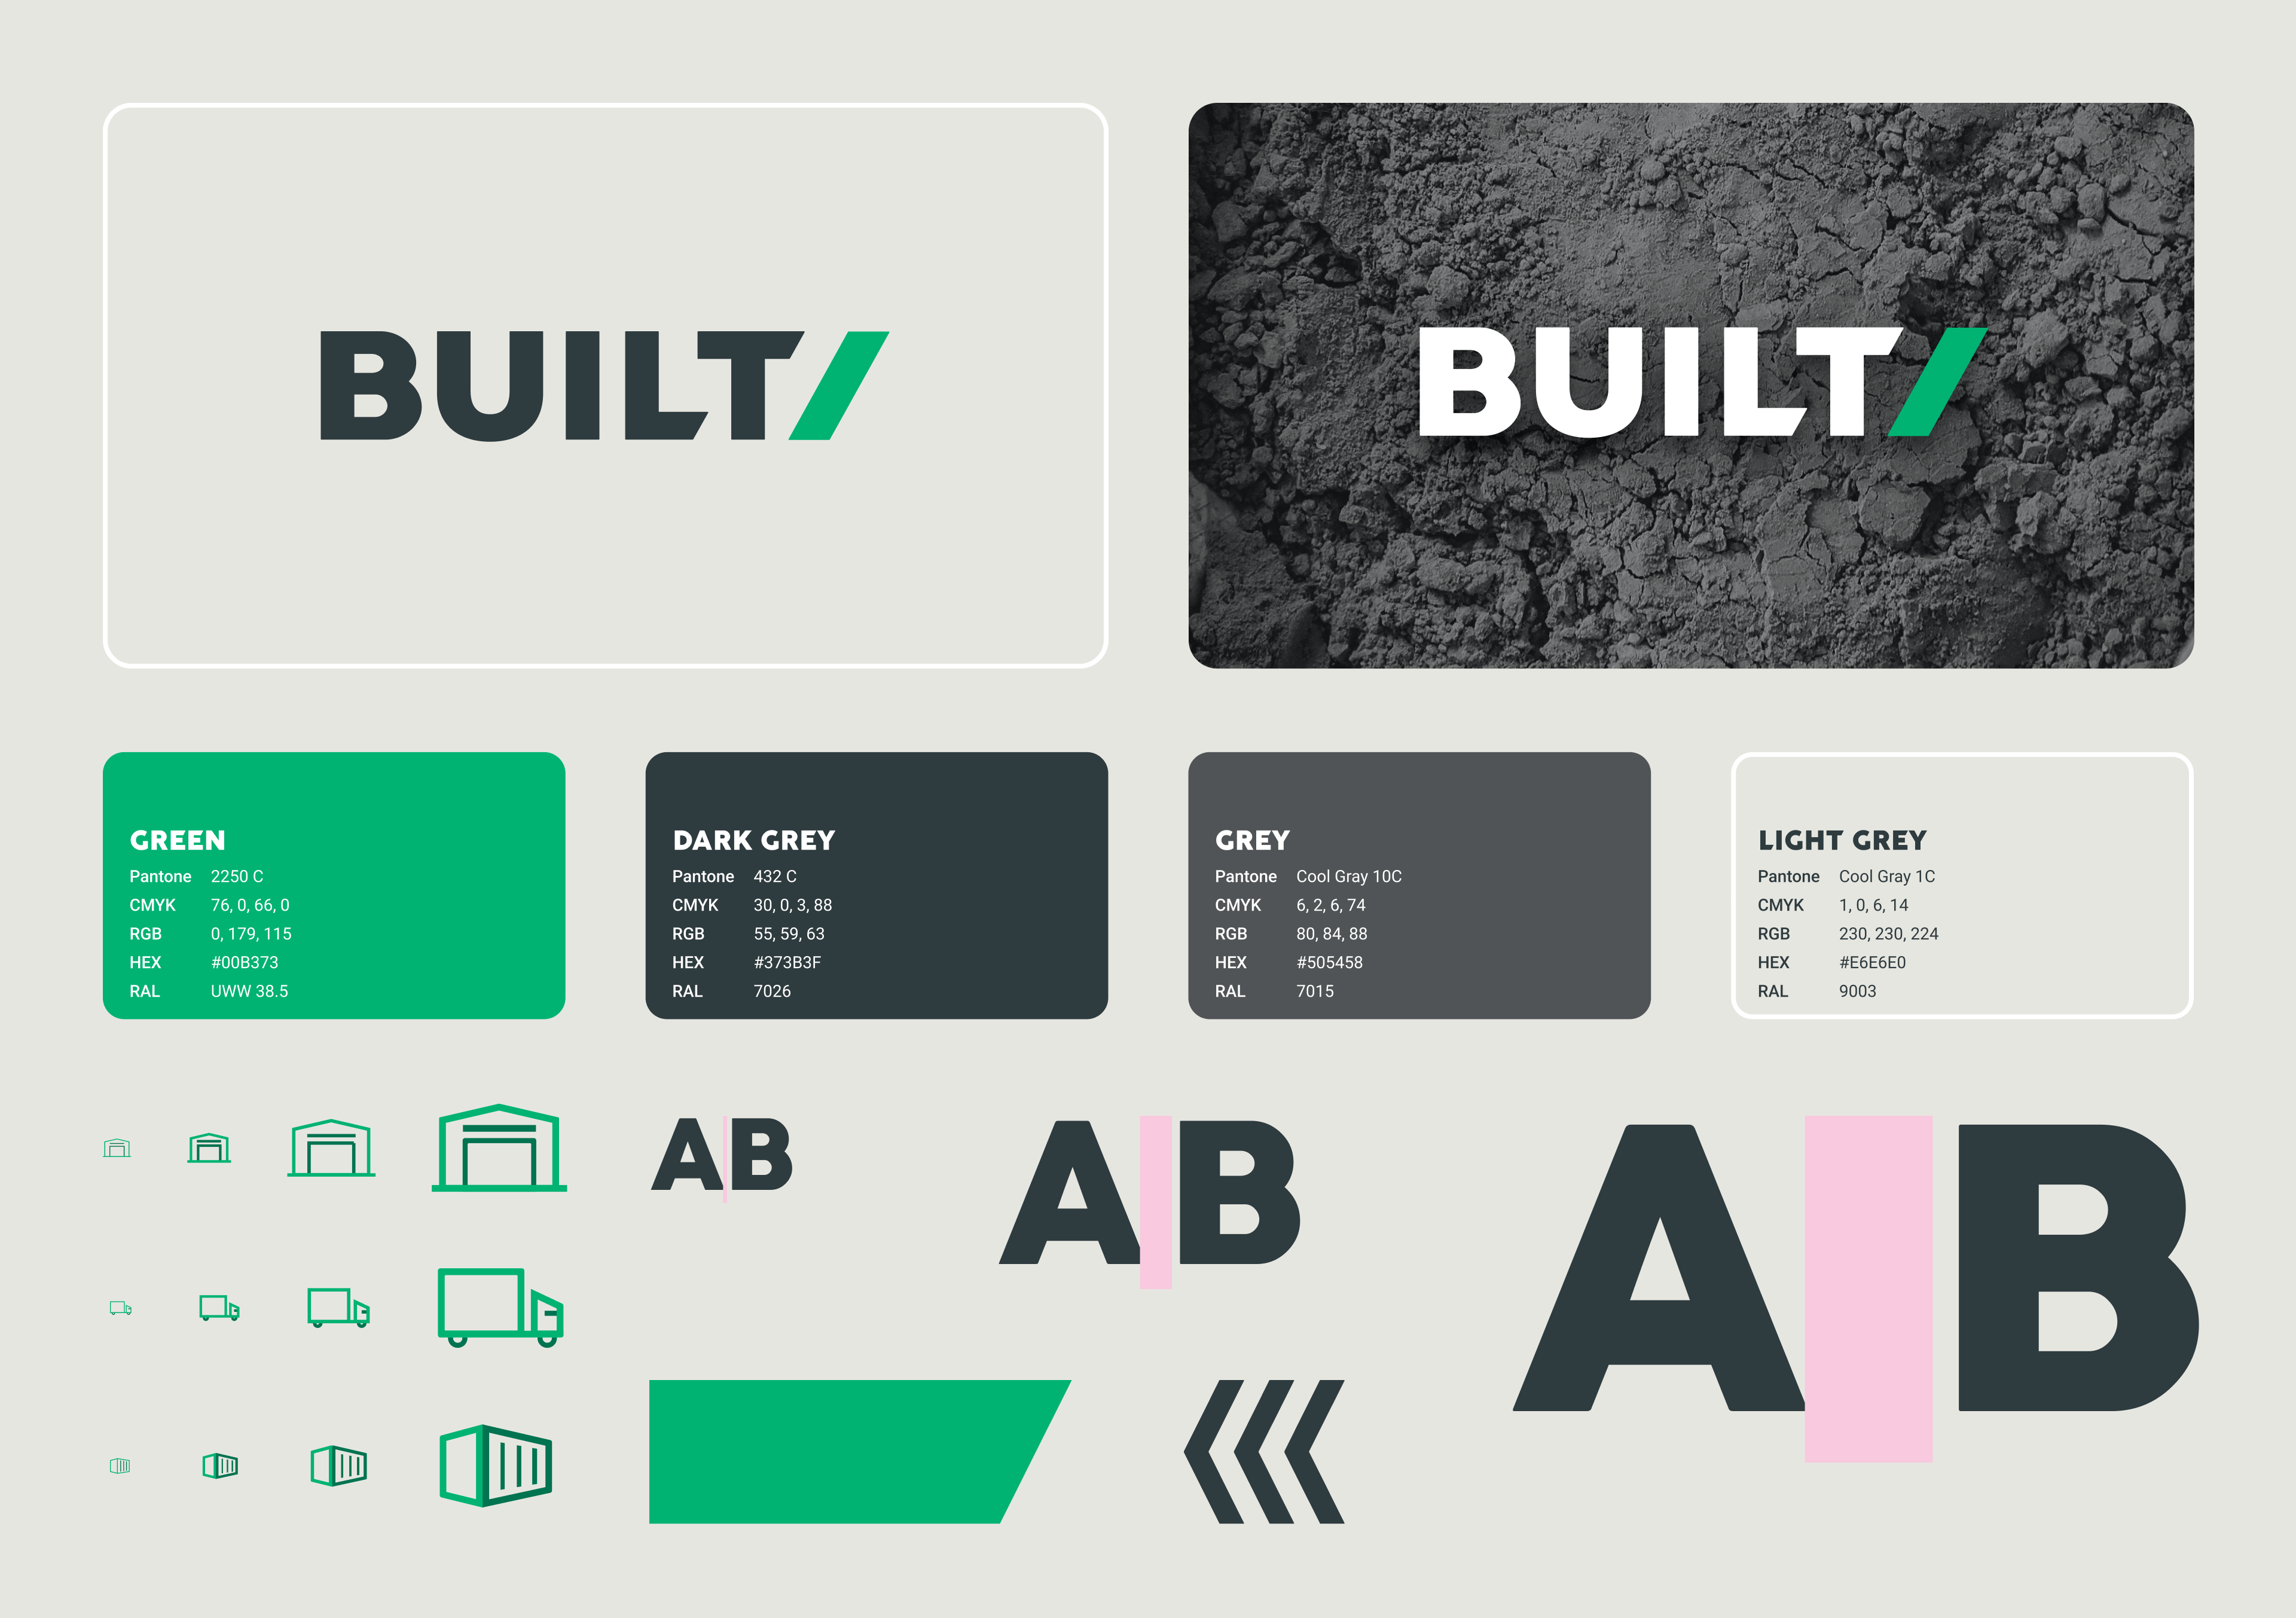
BUILT/
Design consistency across every channel
- 11 experiments executed
- Conducted over 12 sprints
- Measurement period of 6 sprints
- 11 experiments executed
- Conducted over 12 sprints
- Measurement period of 6 sprints
- 11 experiments executed
- Conducted over 12 sprints
- Measurement period of 6 sprints
- 11 experiments executed
- Conducted over 12 sprints
- Measurement period of 6 sprints
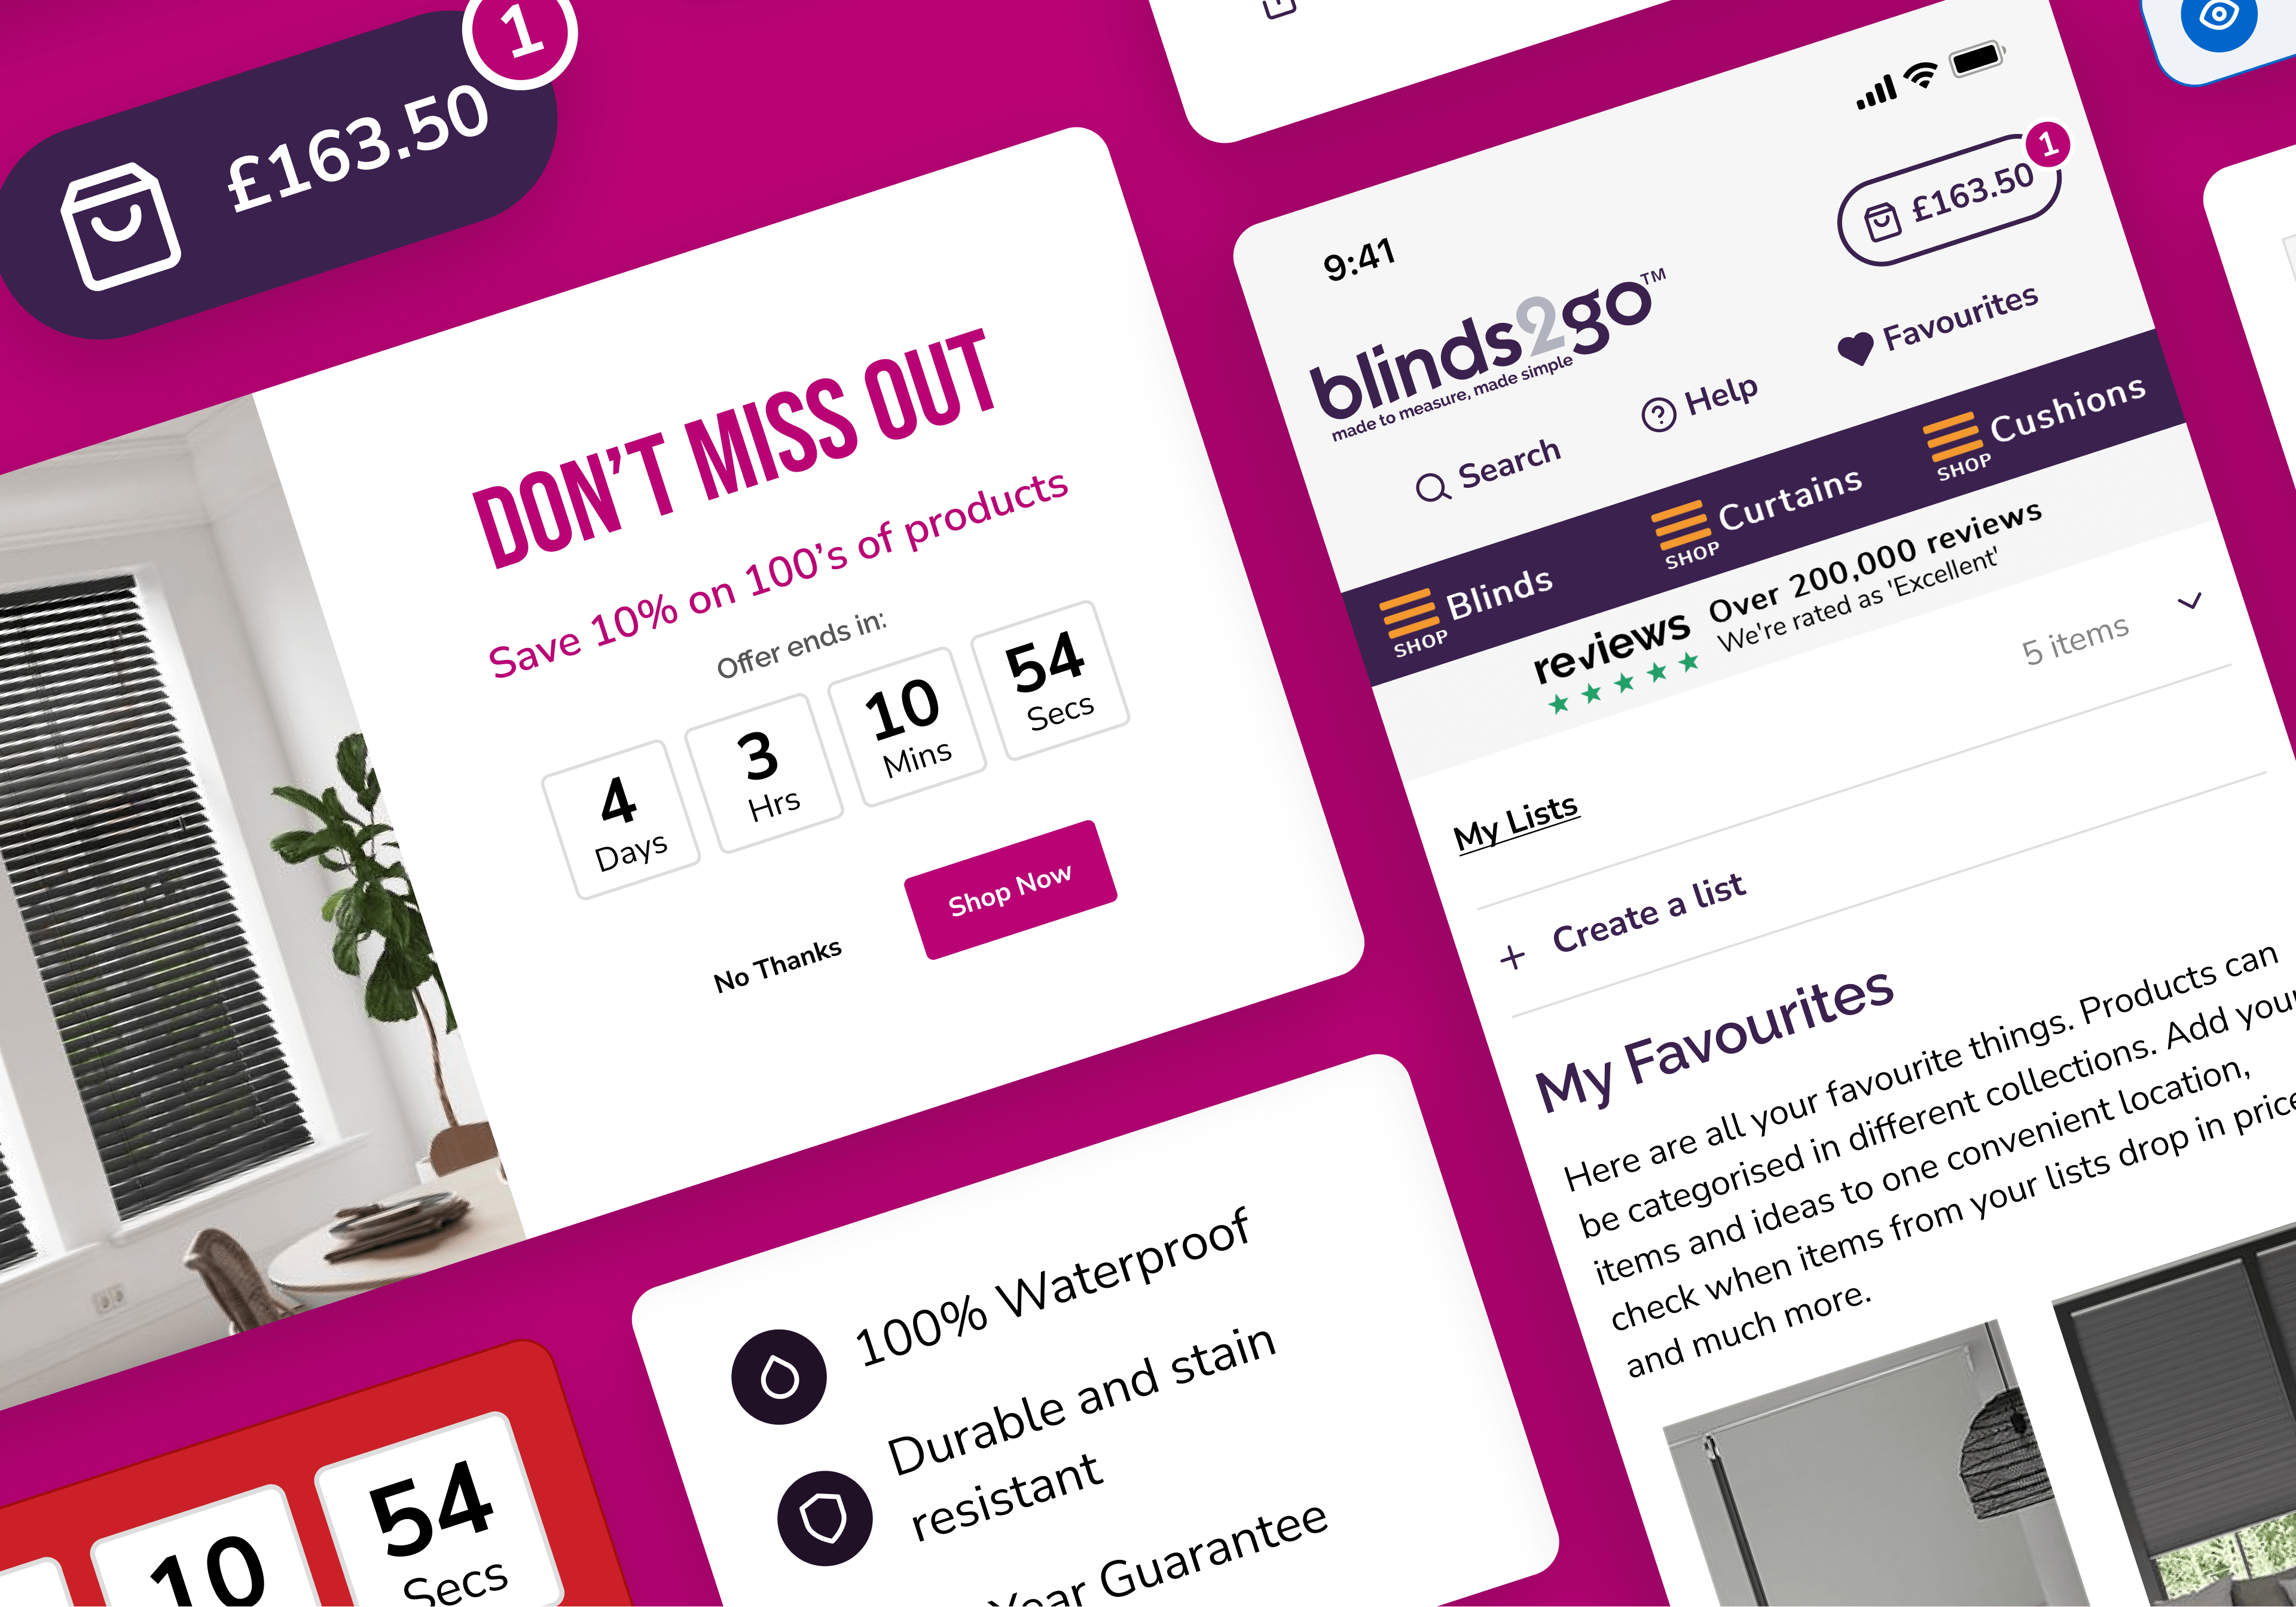
Blinds2Go
Multi-site experiments for a category leader
- Scalable design system fit for multi-site use
- Delivered in one sprint
- Scalable design system fit for multi-site use
- Delivered in one sprint
- Scalable design system fit for multi-site use
- Delivered in one sprint
- Scalable design system fit for multi-site use
- Delivered in one sprint
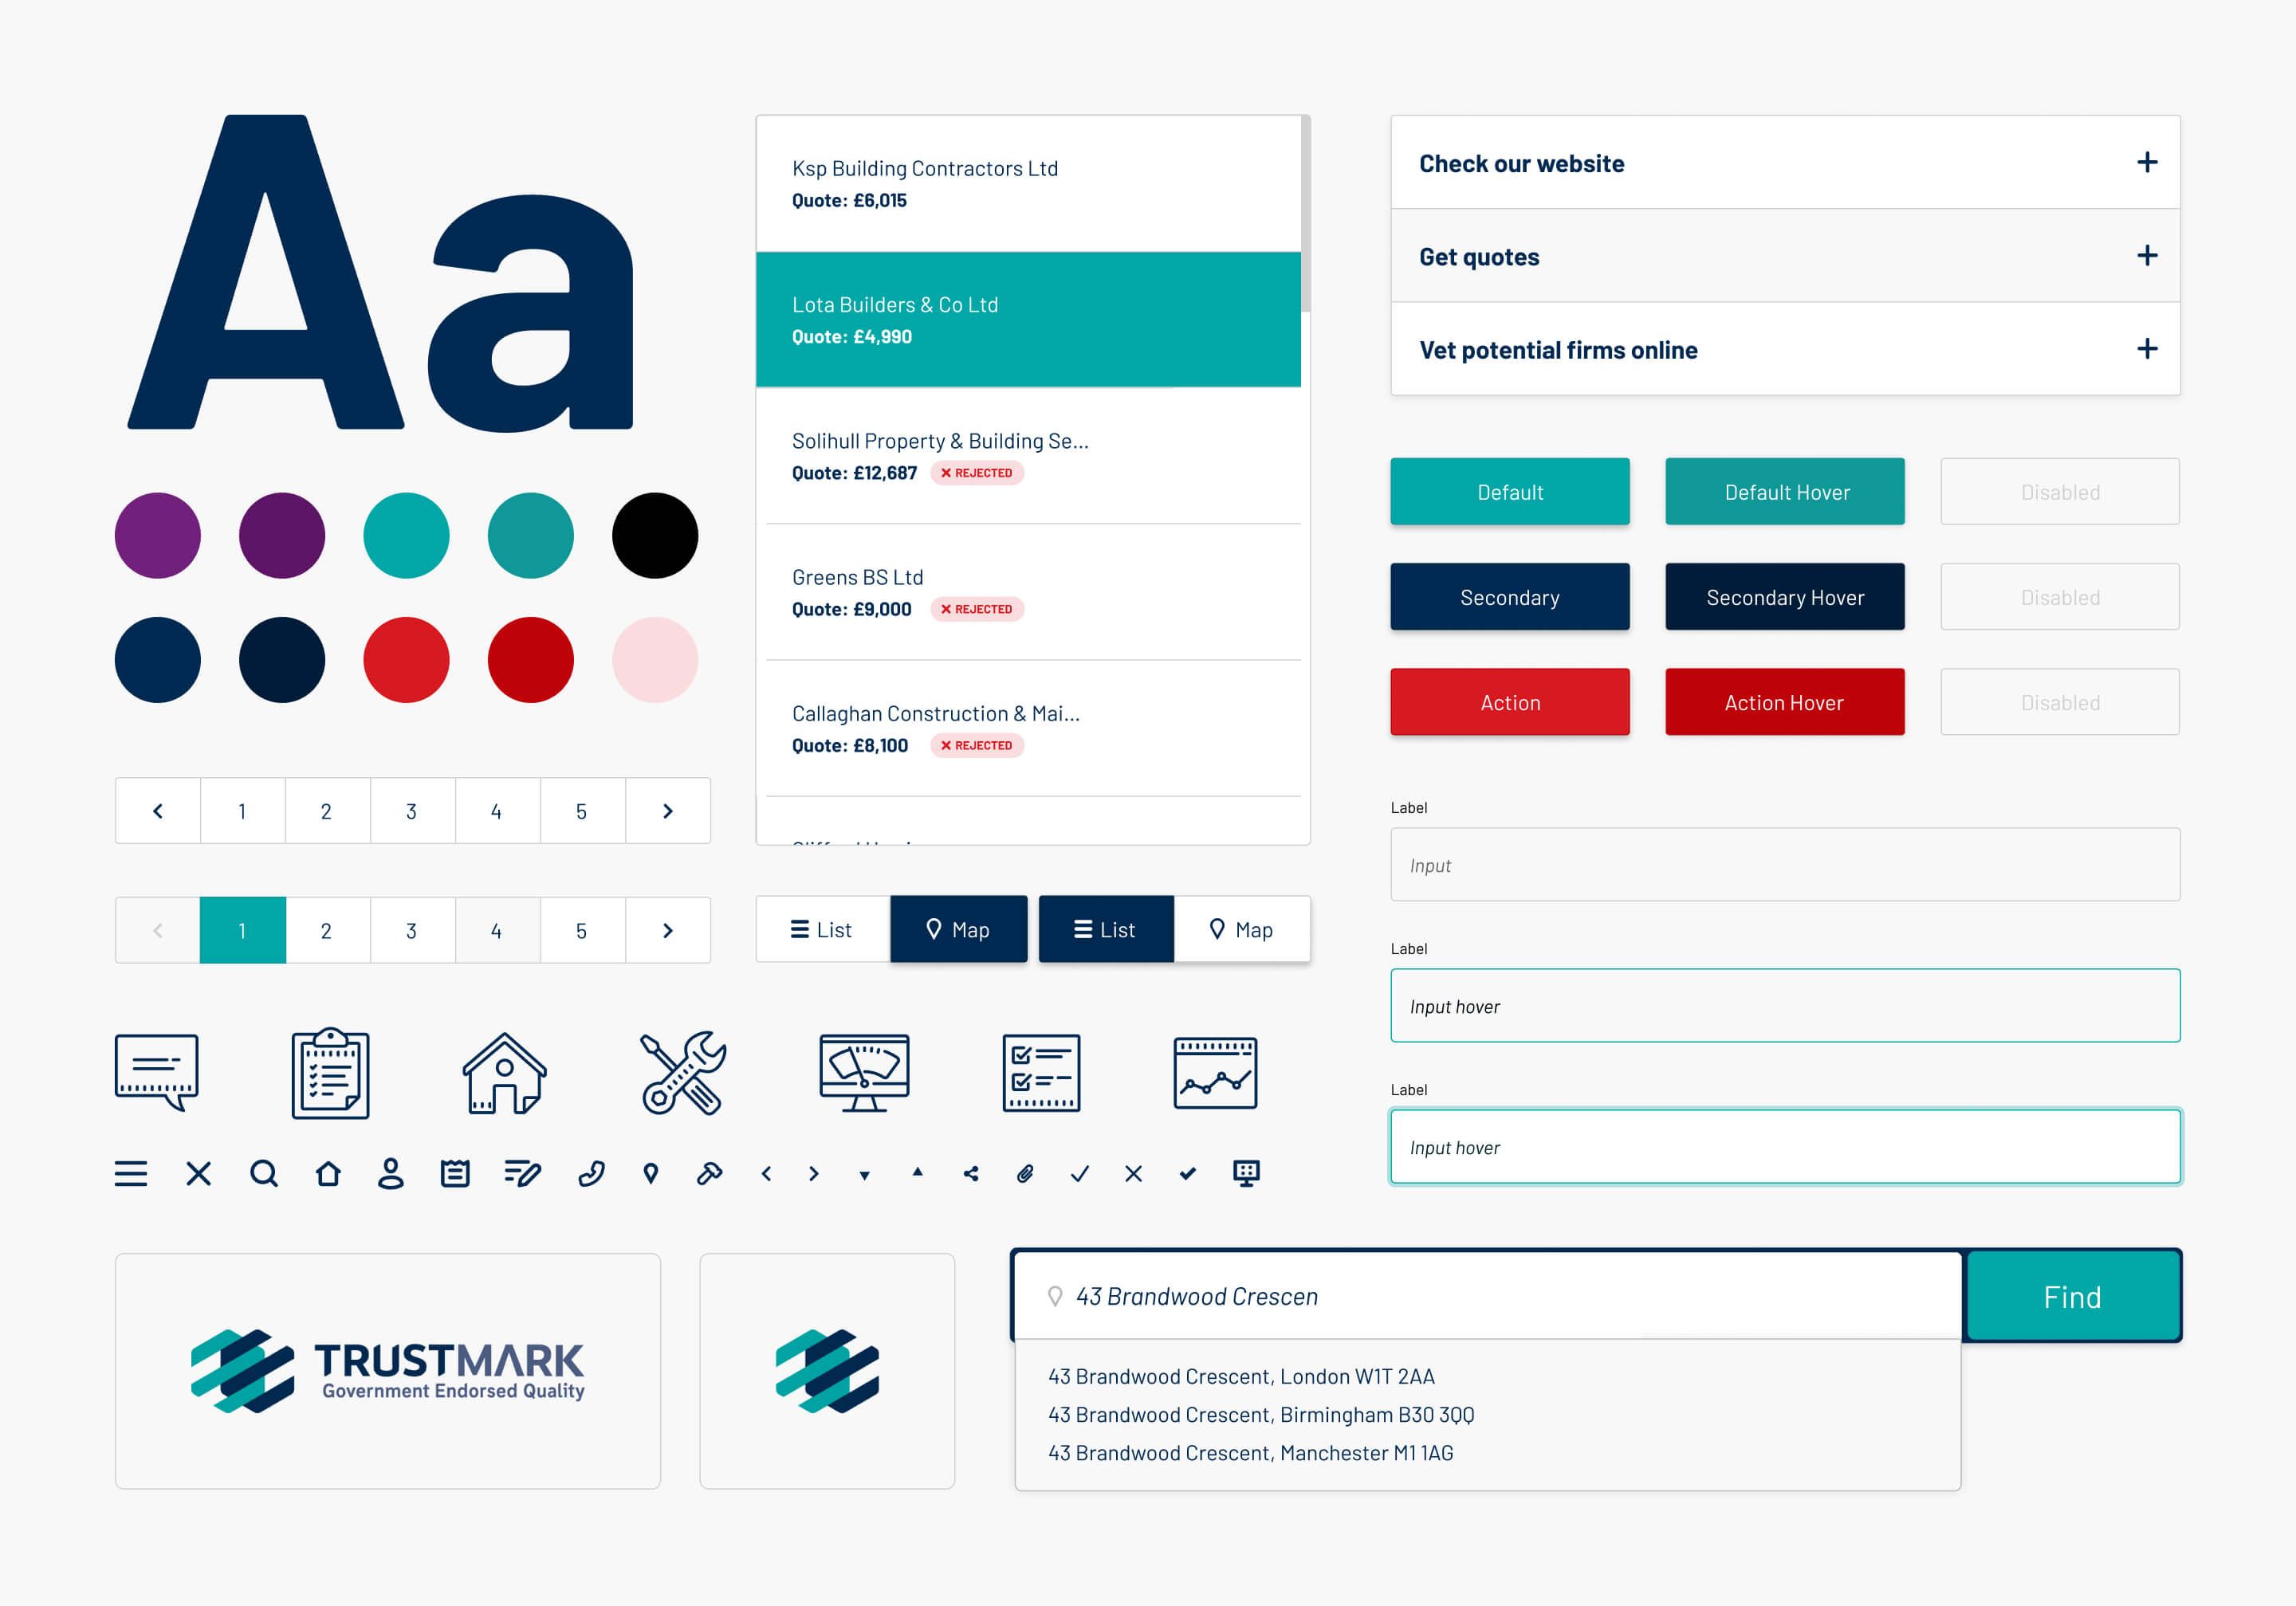
TrustMark
Multi-site design system
- 57 opportunities identified
- Average 12 users participating every sprint
- 57 opportunities identified
- Average 12 users participating every sprint
- 57 opportunities identified
- Average 12 users participating every sprint
- 57 opportunities identified
- Average 12 users participating every sprint
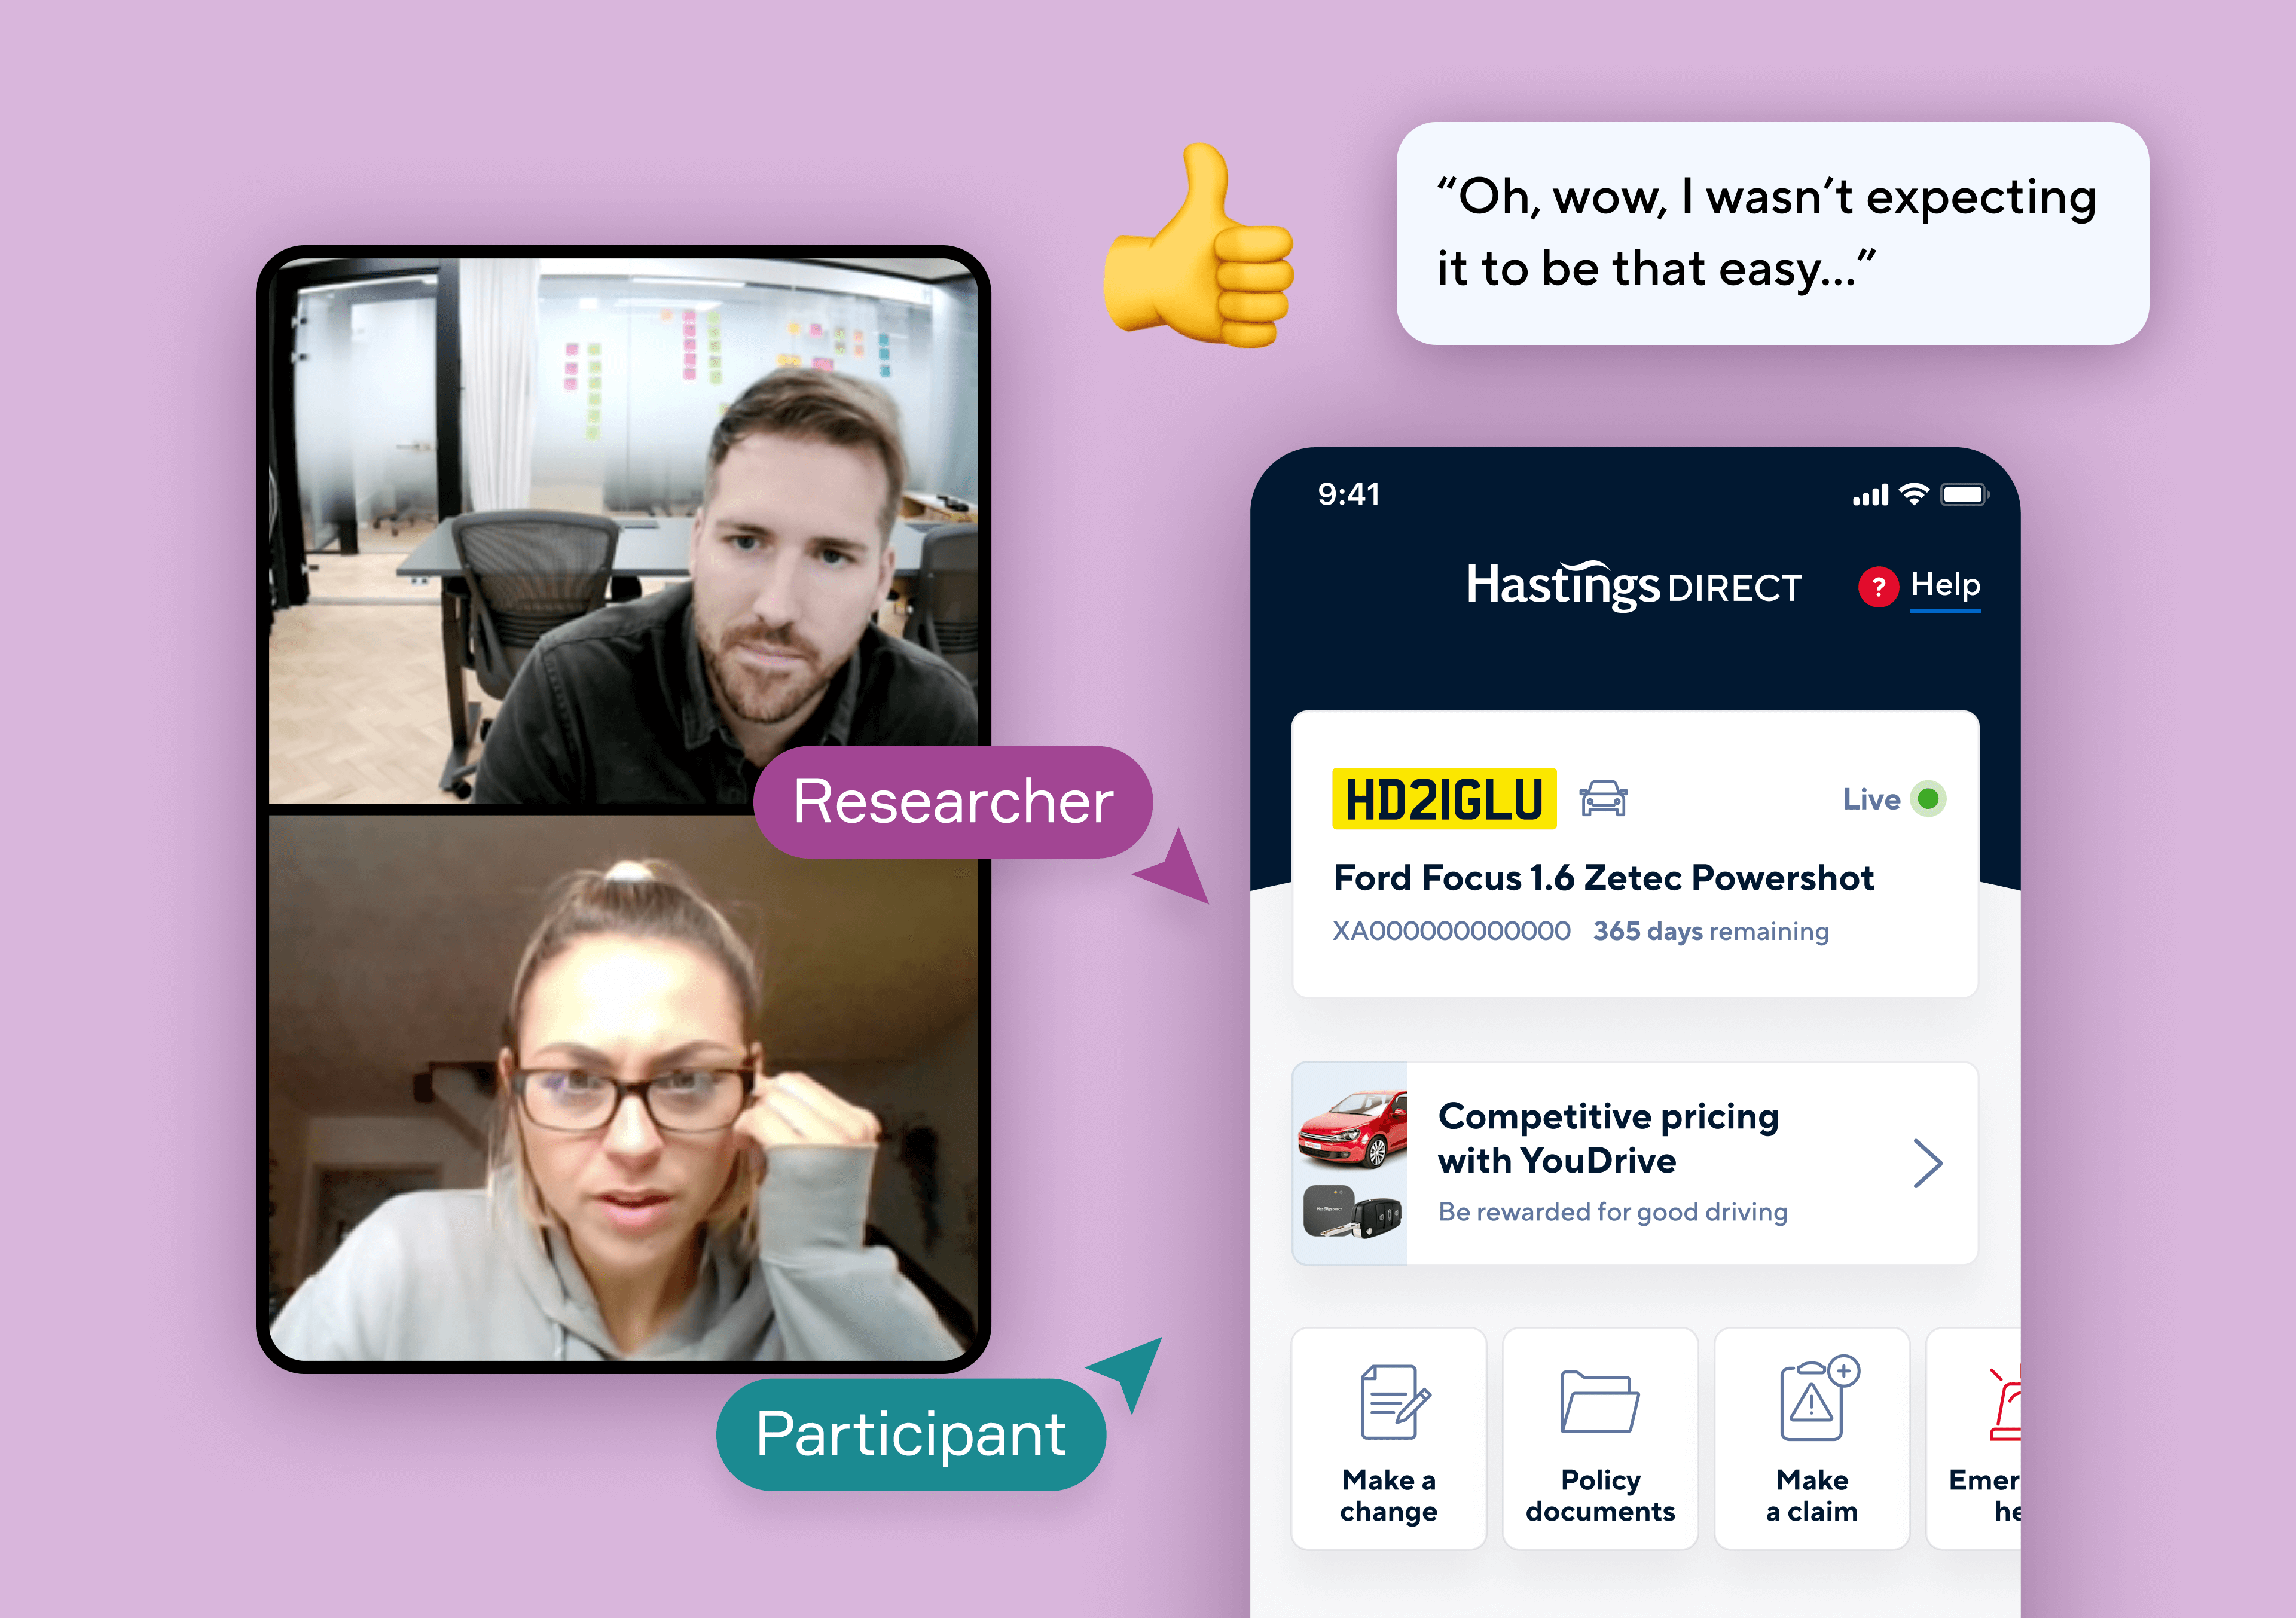
Hastings Direct
Research that identifies critical user insights
- Validated with 4,499 travellers
- 7 critical categories for improvement
- Delivered over 3 sprints
- Validated with 4,499 travellers
- 7 critical categories for improvement
- Delivered over 3 sprints
- Validated with 4,499 travellers
- 7 critical categories for improvement
- Delivered over 3 sprints
- Validated with 4,499 travellers
- 7 critical categories for improvement
- Delivered over 3 sprints
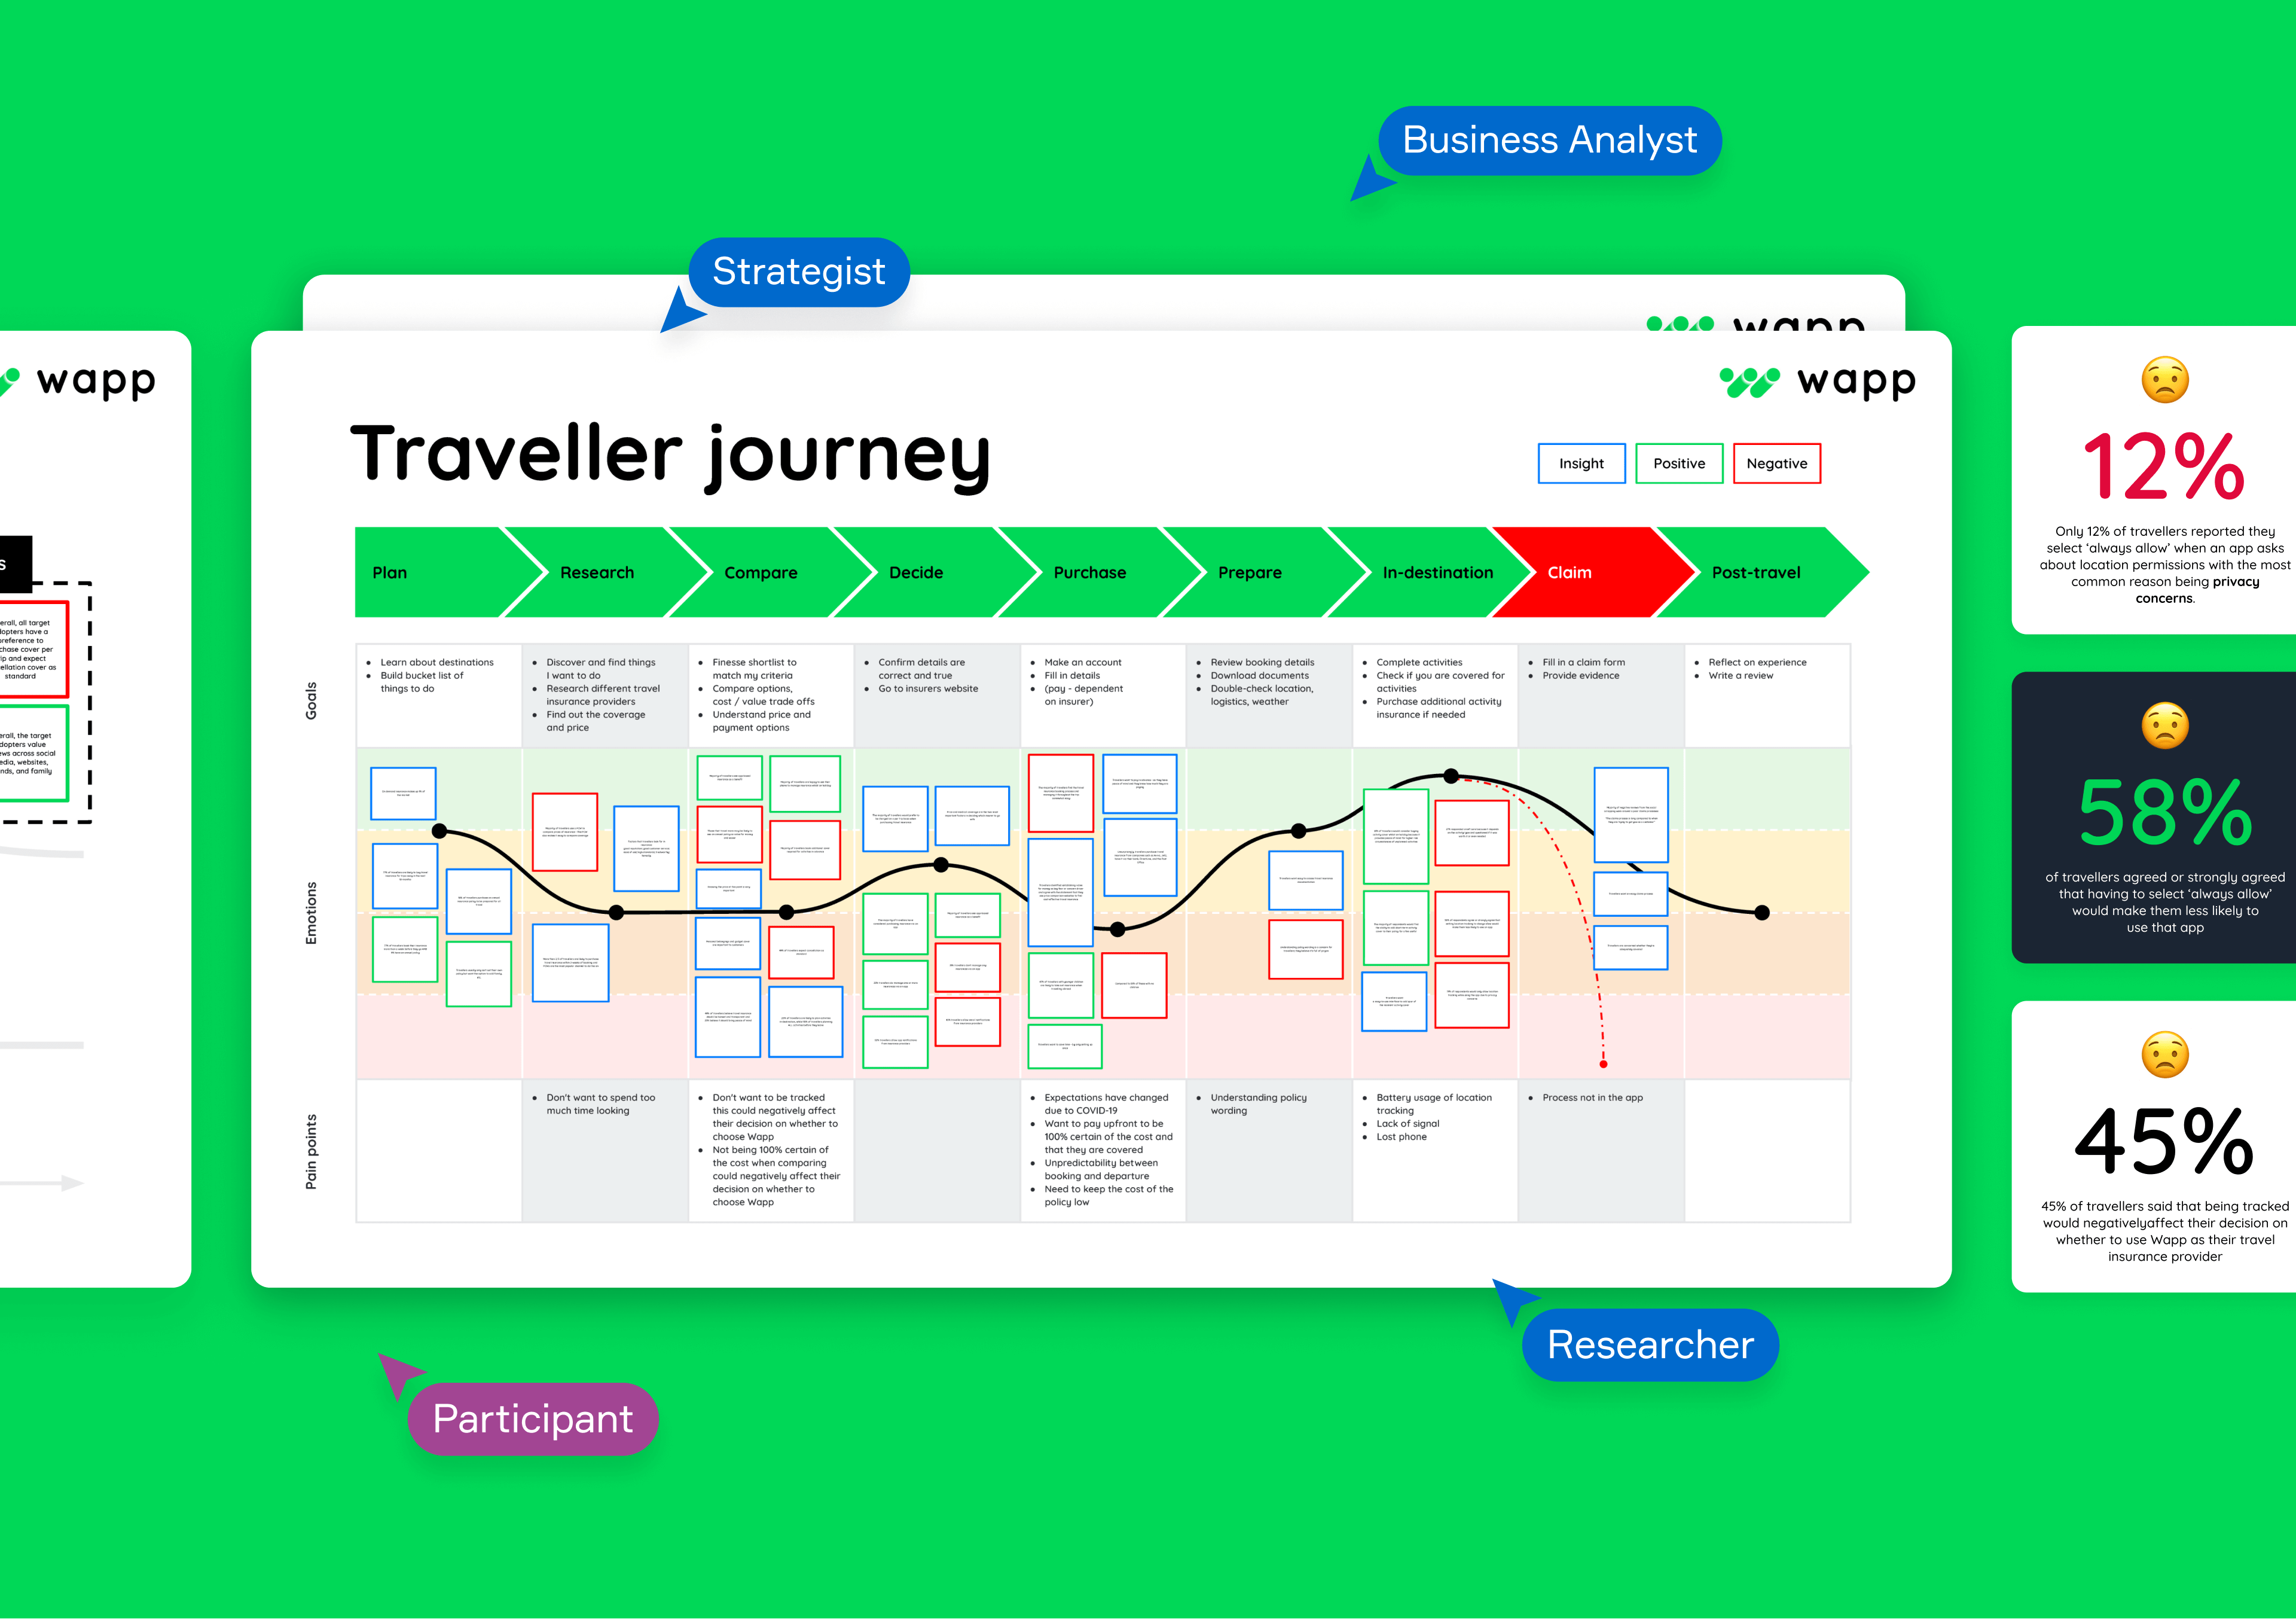
Wapp
Validating a new travel insurance proposition
- MoM conversion rate of 6.9%
- LFL quarterly revenue of £265K
- MoM conversion rate of 6.9%
- LFL quarterly revenue of £265K
- MoM conversion rate of 6.9%
- LFL quarterly revenue of £265K
- MoM conversion rate of 6.9%
- LFL quarterly revenue of £265K
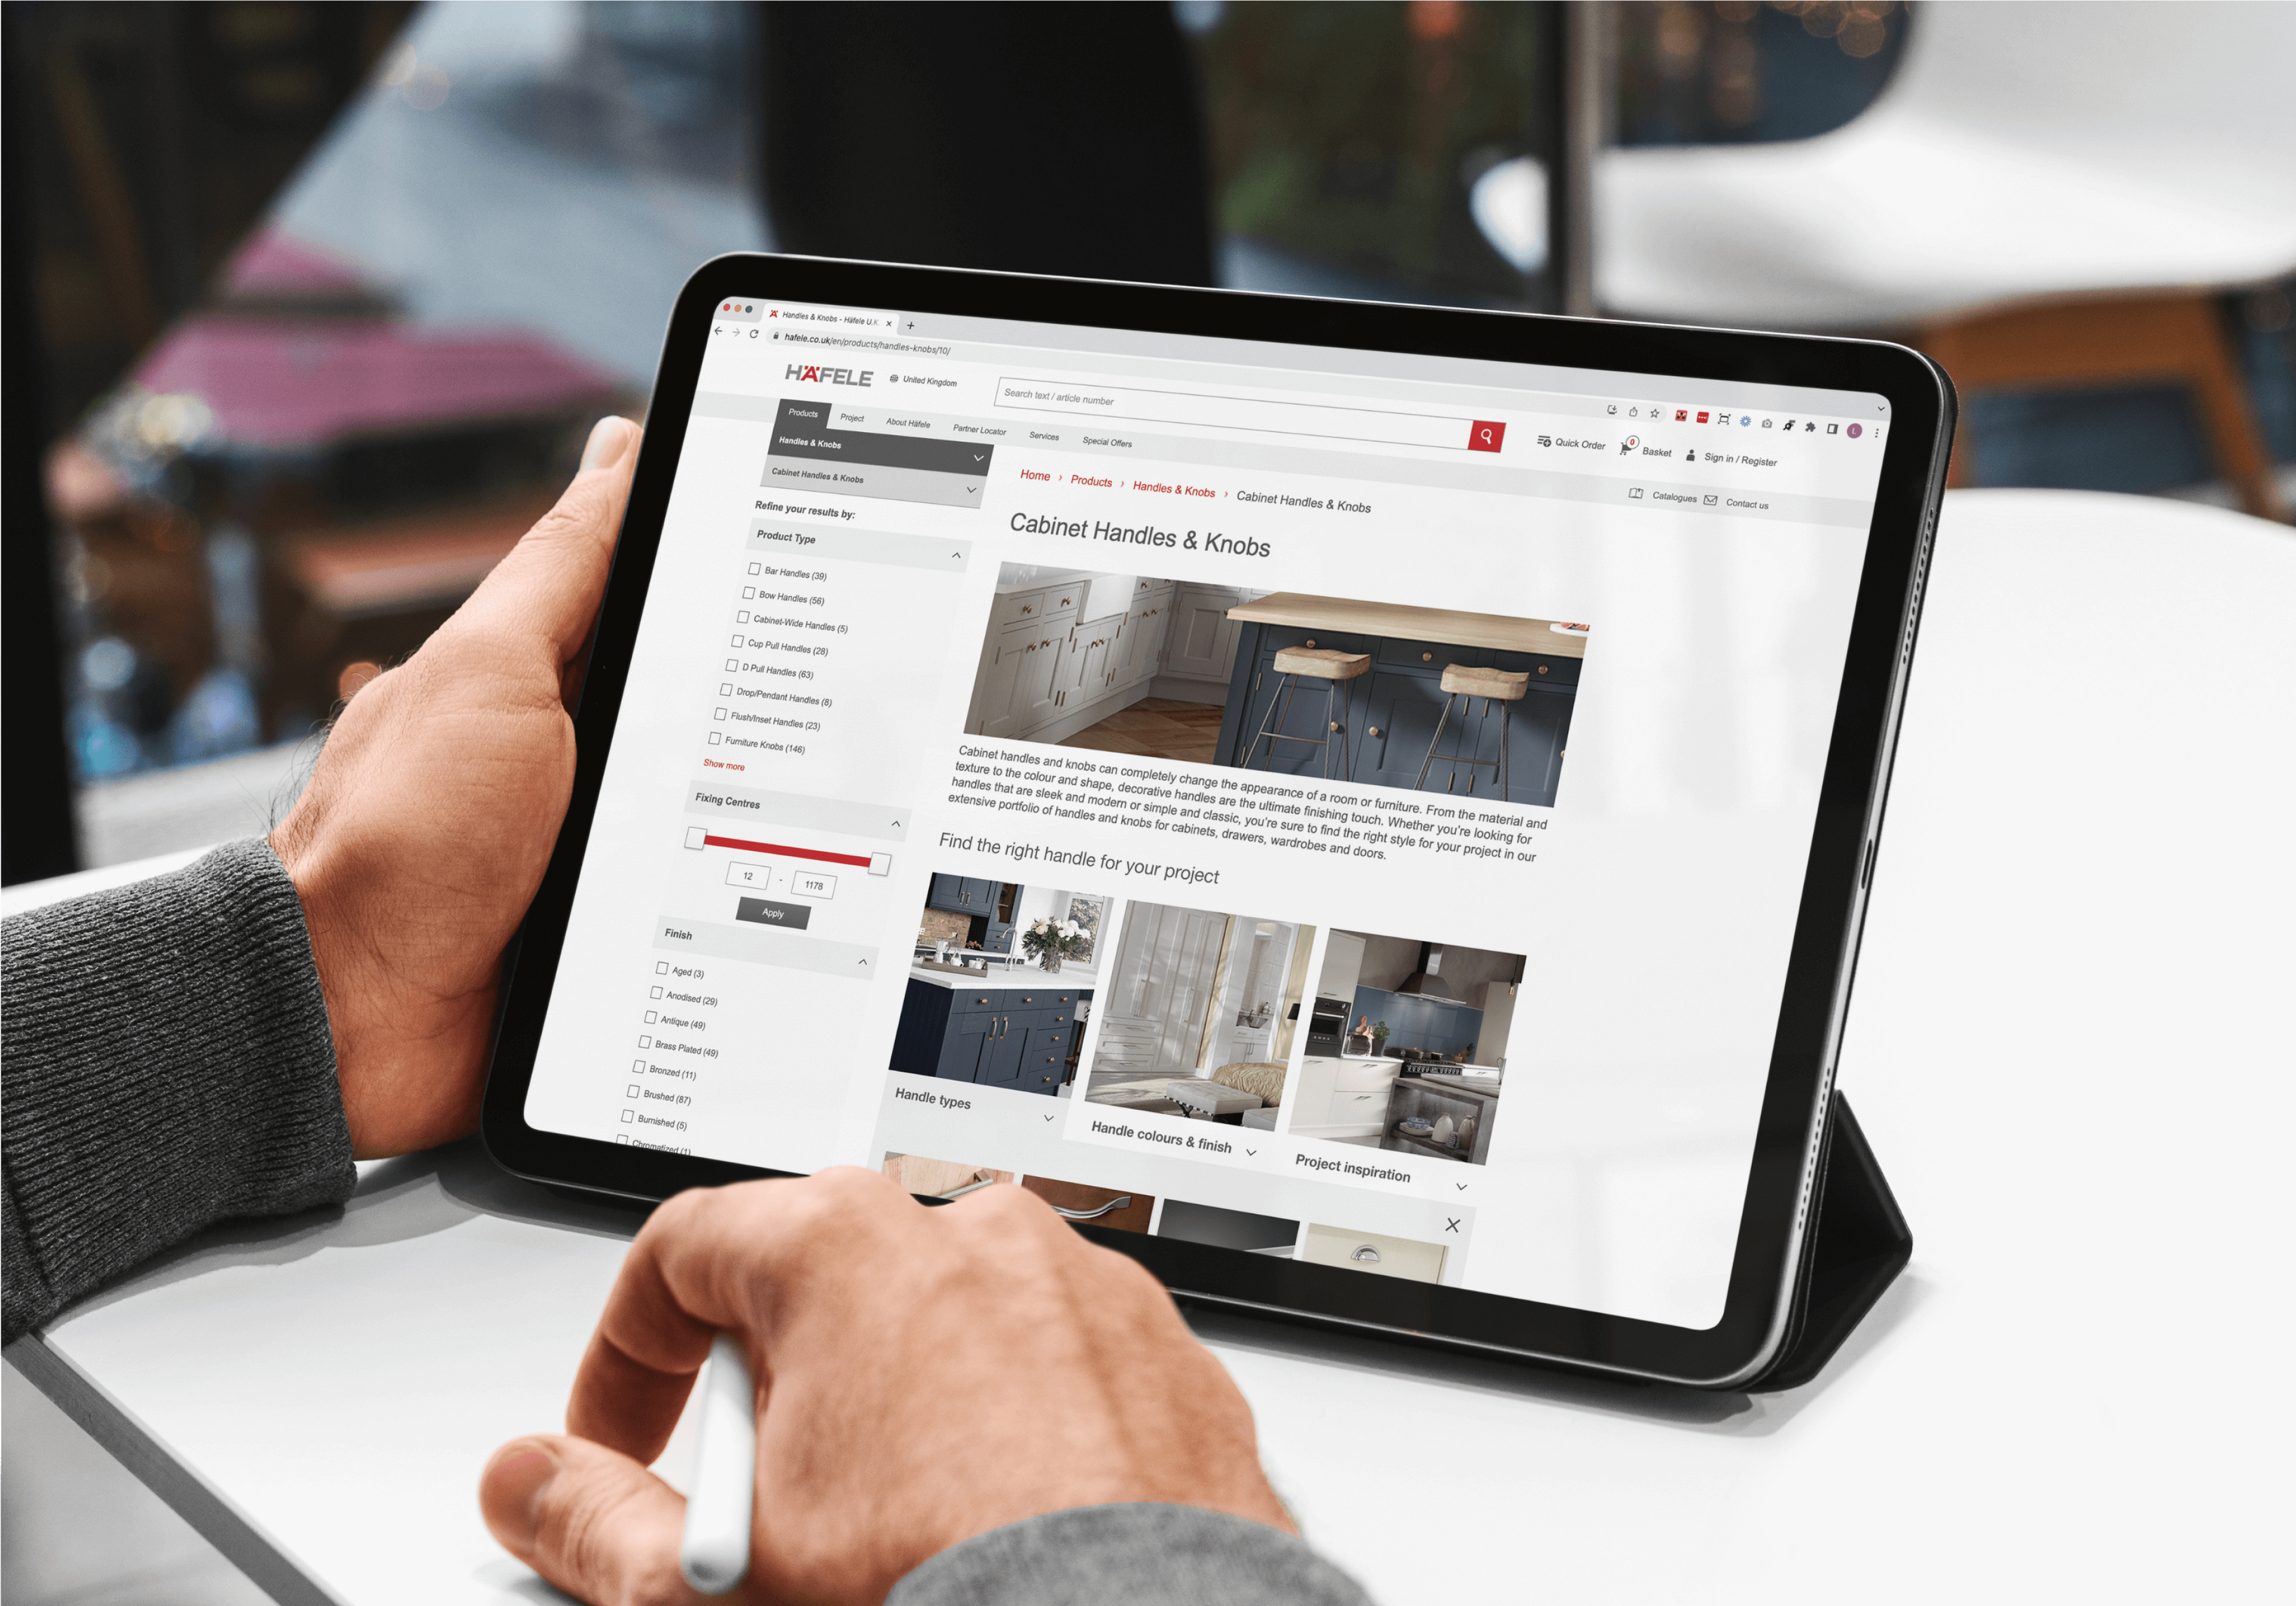
Hafele UK
Profitability through continual optimisation
- 24 core screens designed across core journey
- Delivered across two sprints
- 24 core screens designed across core journey
- Delivered across two sprints
- 24 core screens designed across core journey
- Delivered across two sprints
- 24 core screens designed across core journey
- Delivered across two sprints
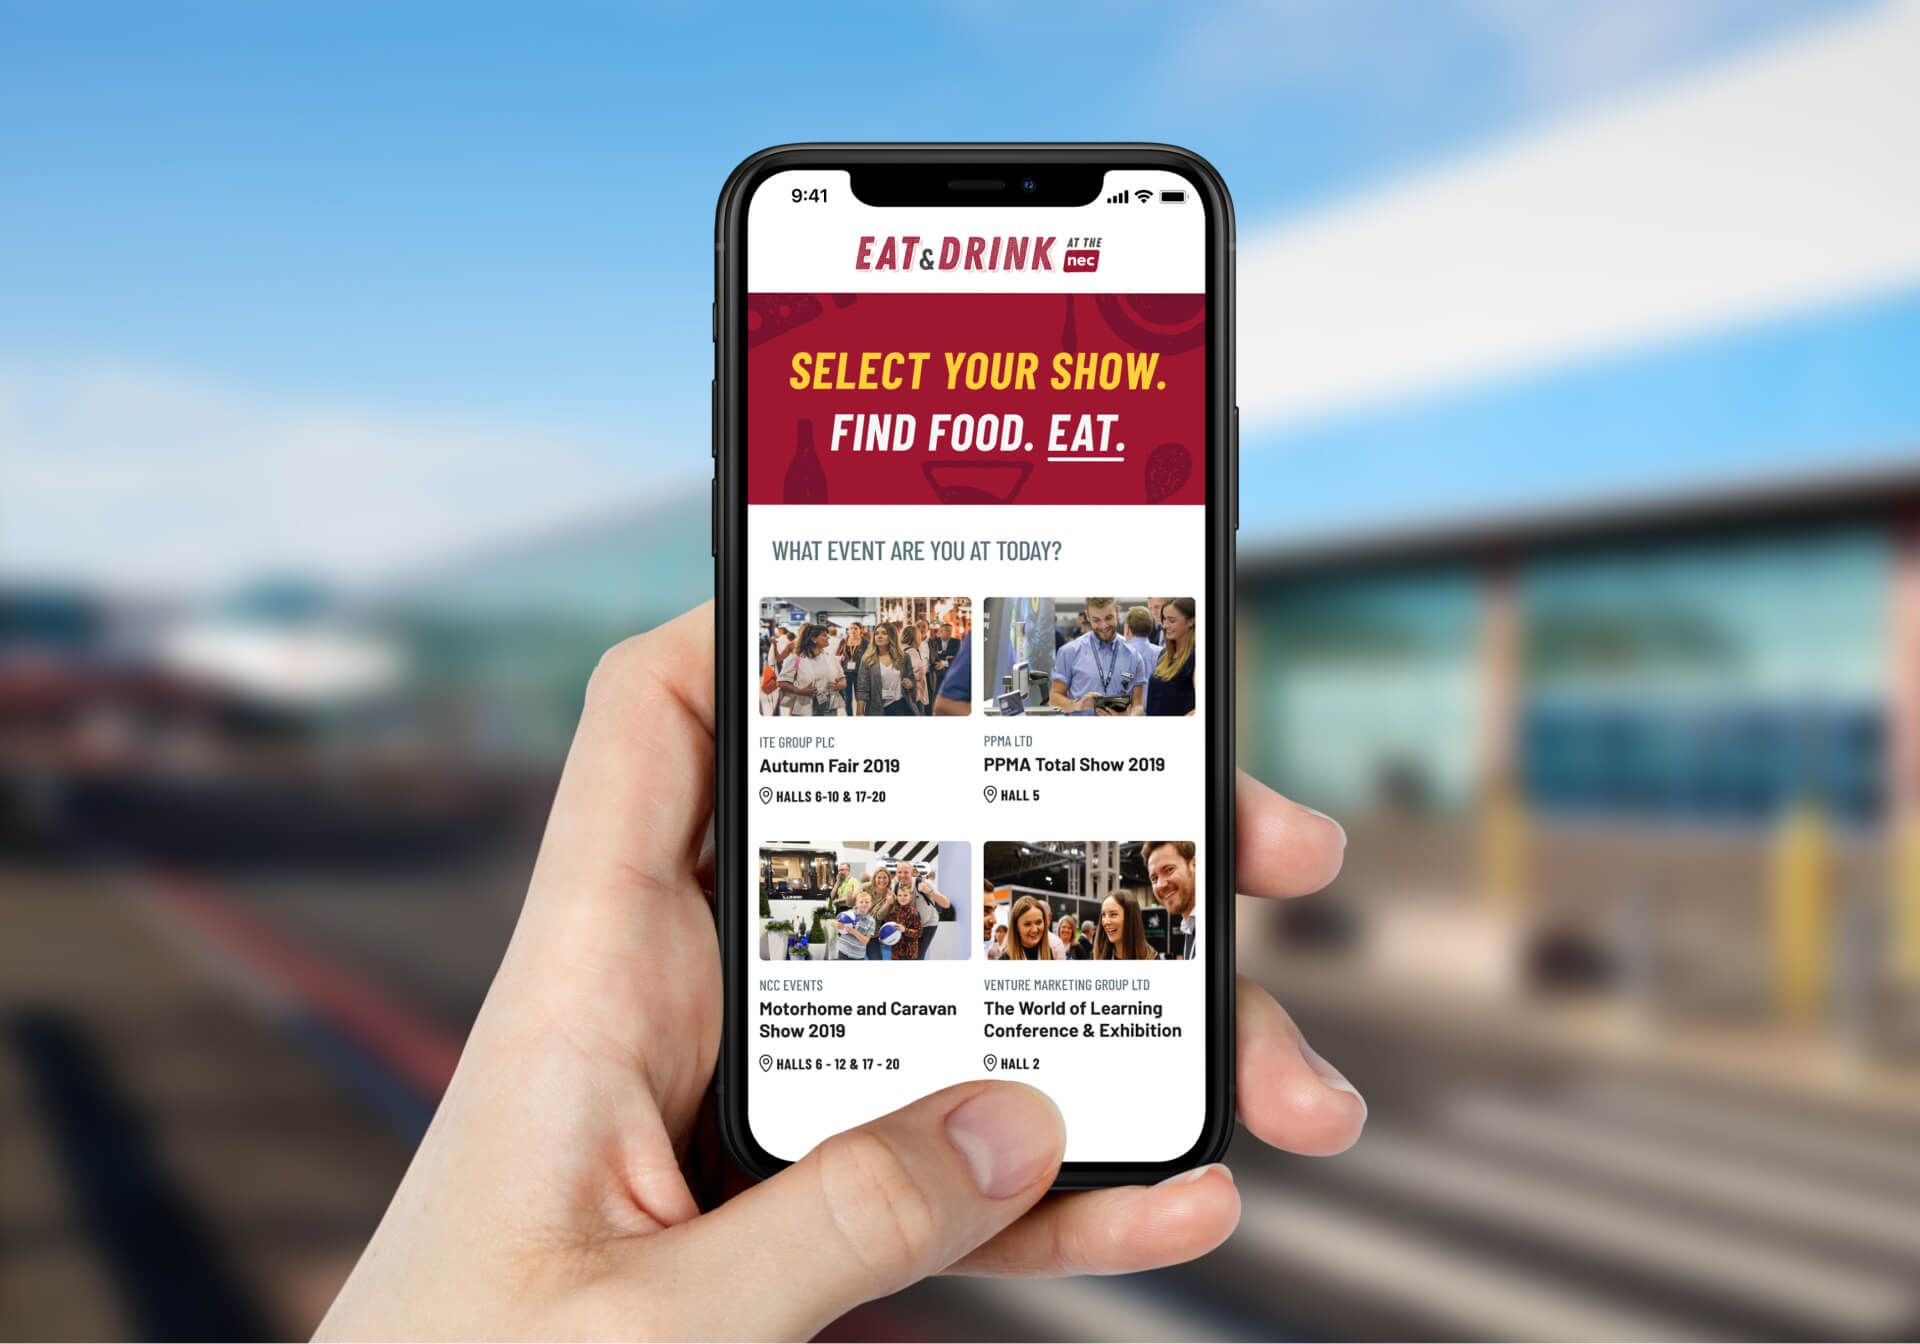
NEC
In-destination food and drink finder
- 17 core screens designed across core journey
- Delivered across four sprints
- 17 core screens designed across core journey
- Delivered across four sprints
- 17 core screens designed across core journey
- Delivered across four sprints
- 17 core screens designed across core journey
- Delivered across four sprints
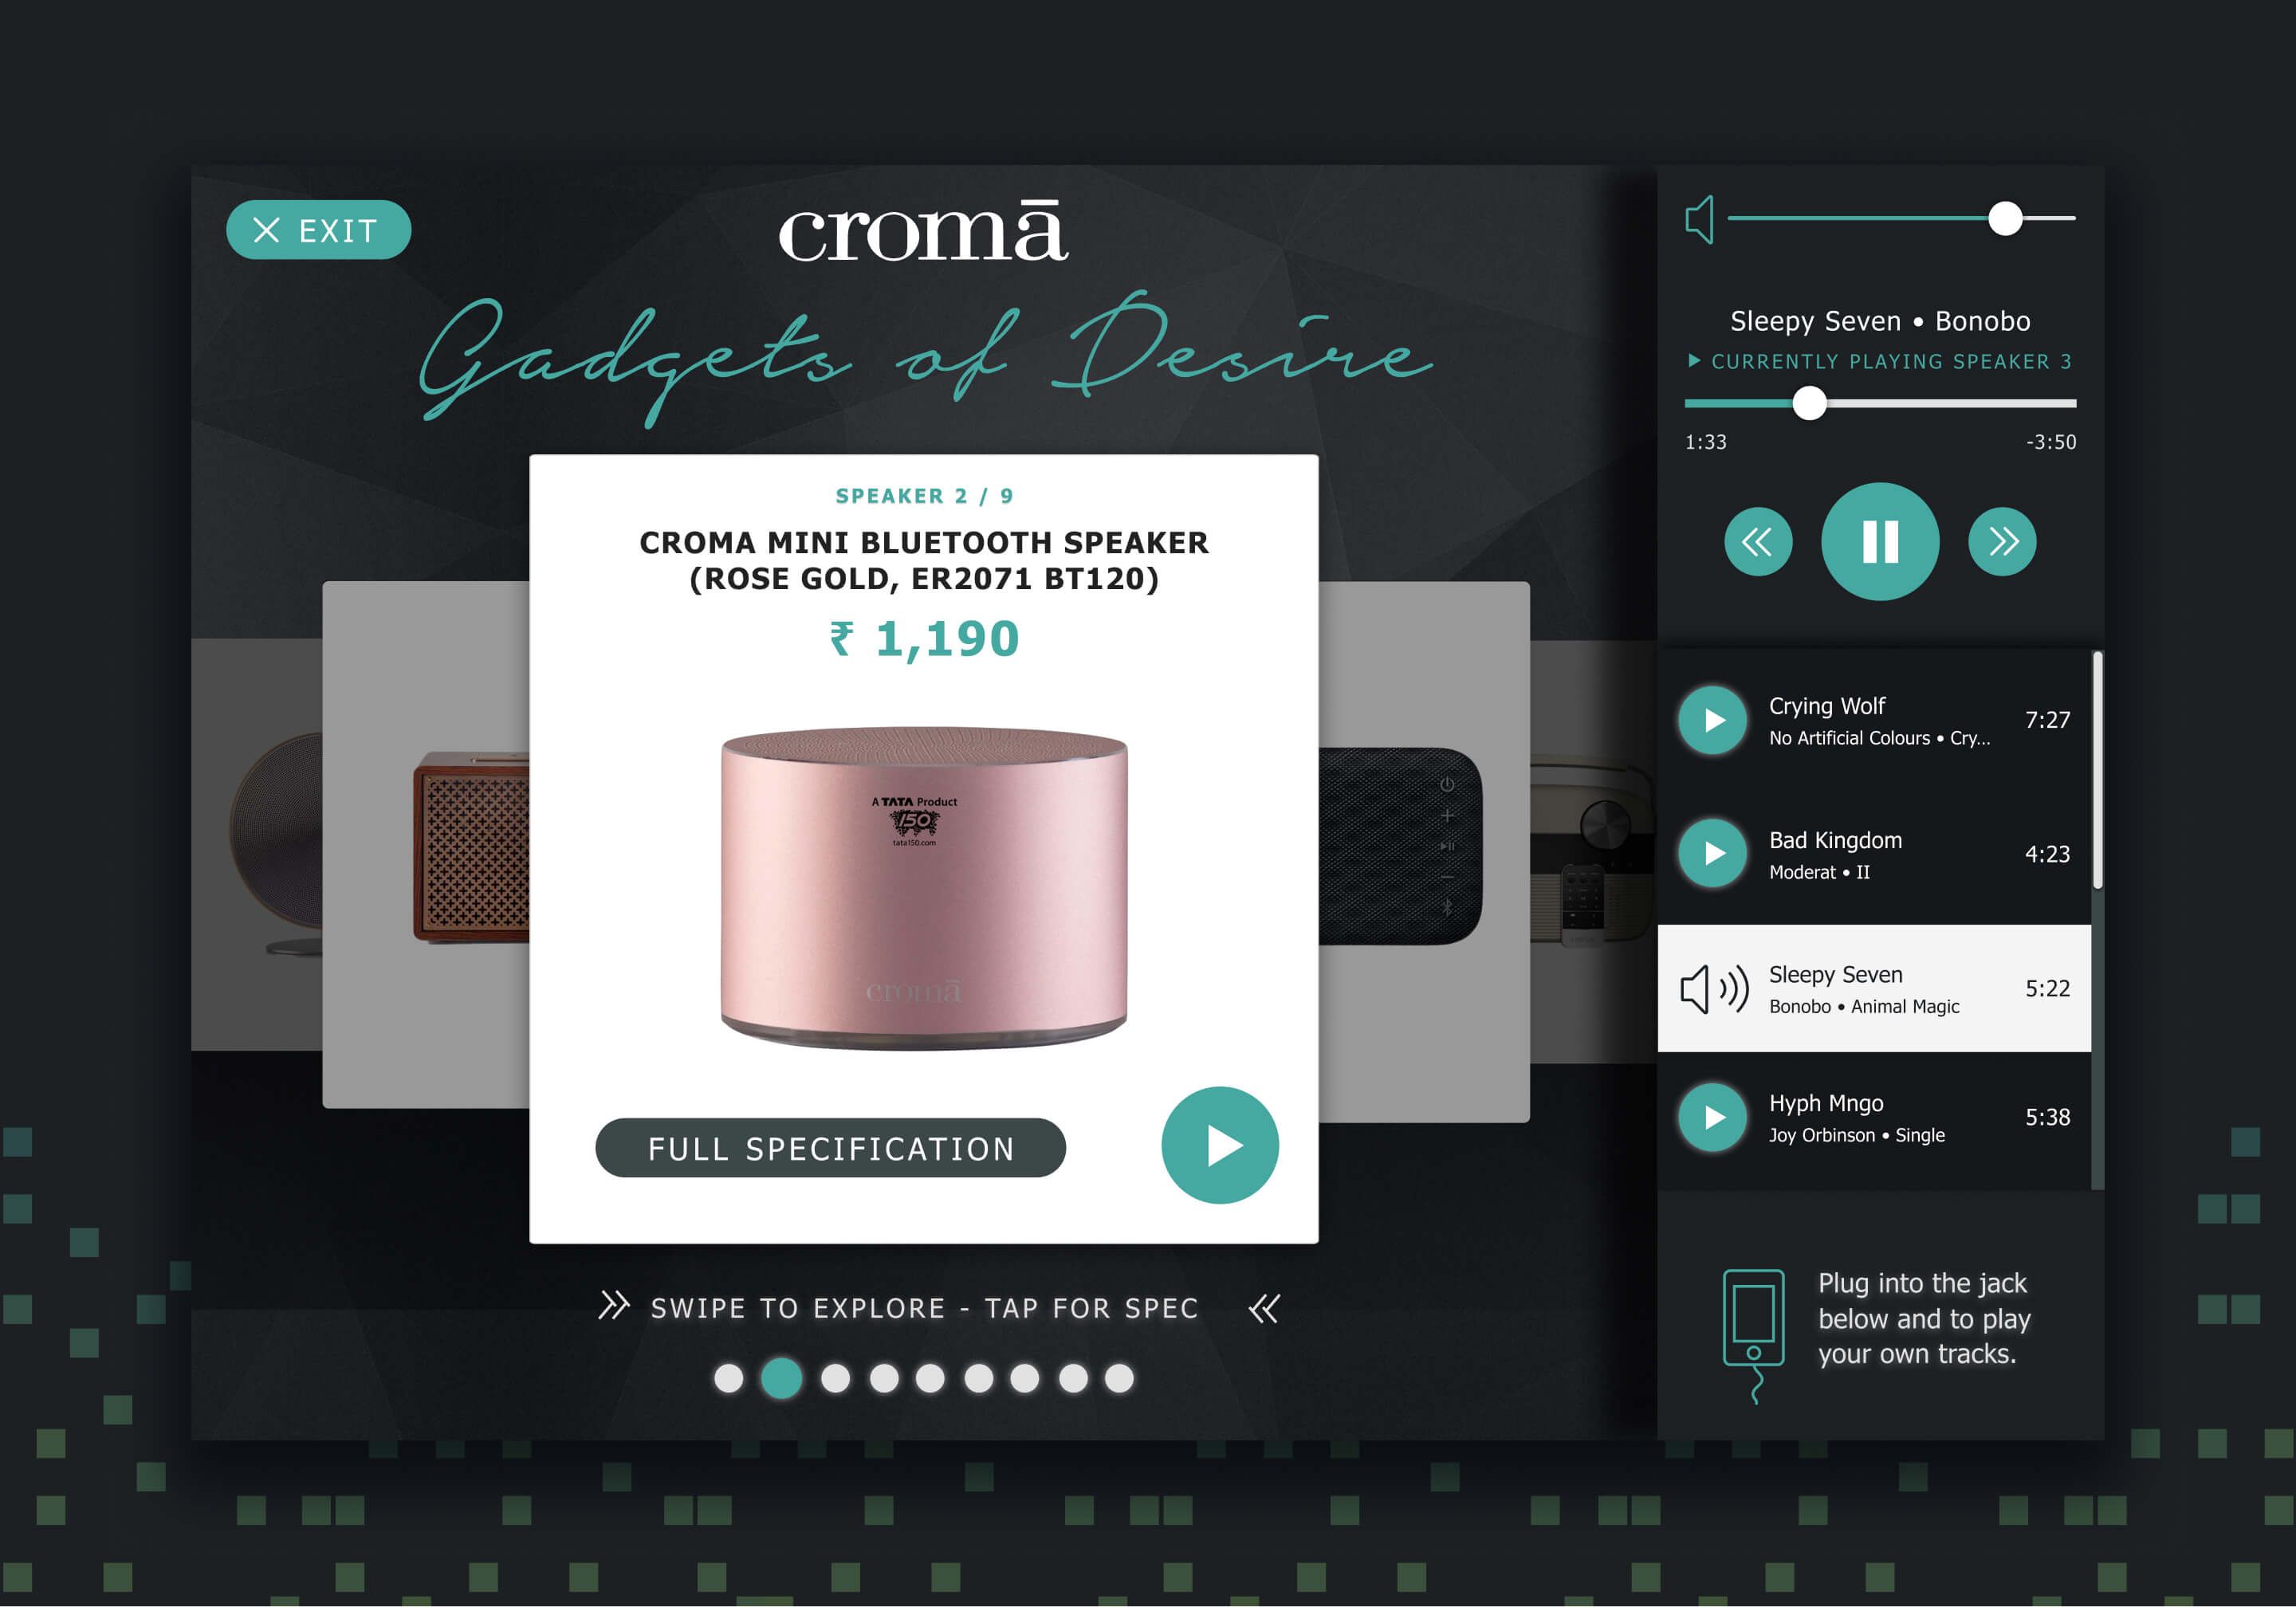
Croma
In-store digital kiosk experiences
- 52 core components across the design system
- Delivered across two sprints
- 52 core components across the design system
- Delivered across two sprints
- 52 core components across the design system
- Delivered across two sprints
- 52 core components across the design system
- Delivered across two sprints
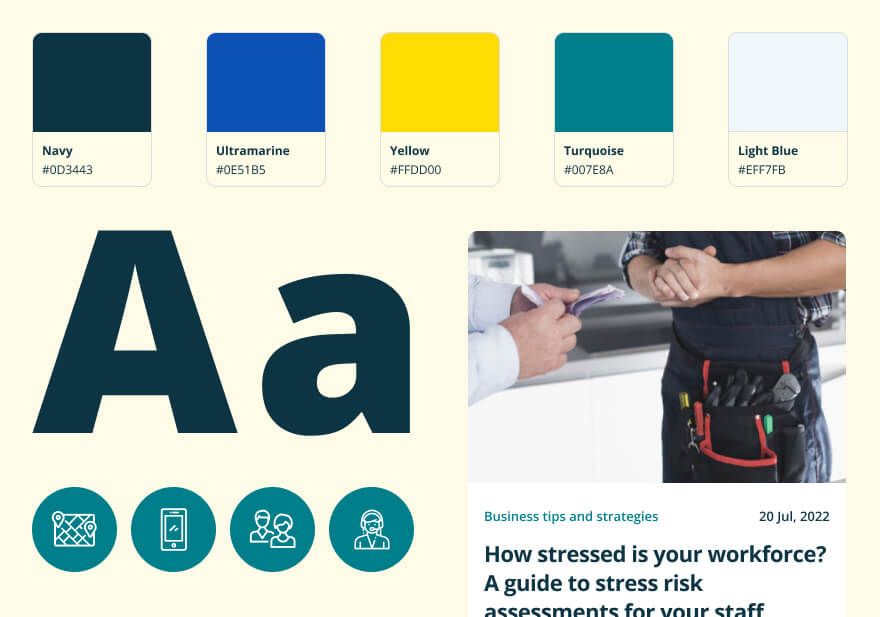
Joblogic
Brochureware website design system
- +£1.03m in monthly lend
- +102% in lead acquisition QoQ
- ROI of ~+10.6% per £1K
- +£1.03m in monthly lend
- +102% in lead acquisition QoQ
- ROI of ~+10.6% per £1K
- +£1.03m in monthly lend
- +102% in lead acquisition QoQ
- ROI of ~+10.6% per £1K
- +£1.03m in monthly lend
- +102% in lead acquisition QoQ
- ROI of ~+10.6% per £1K
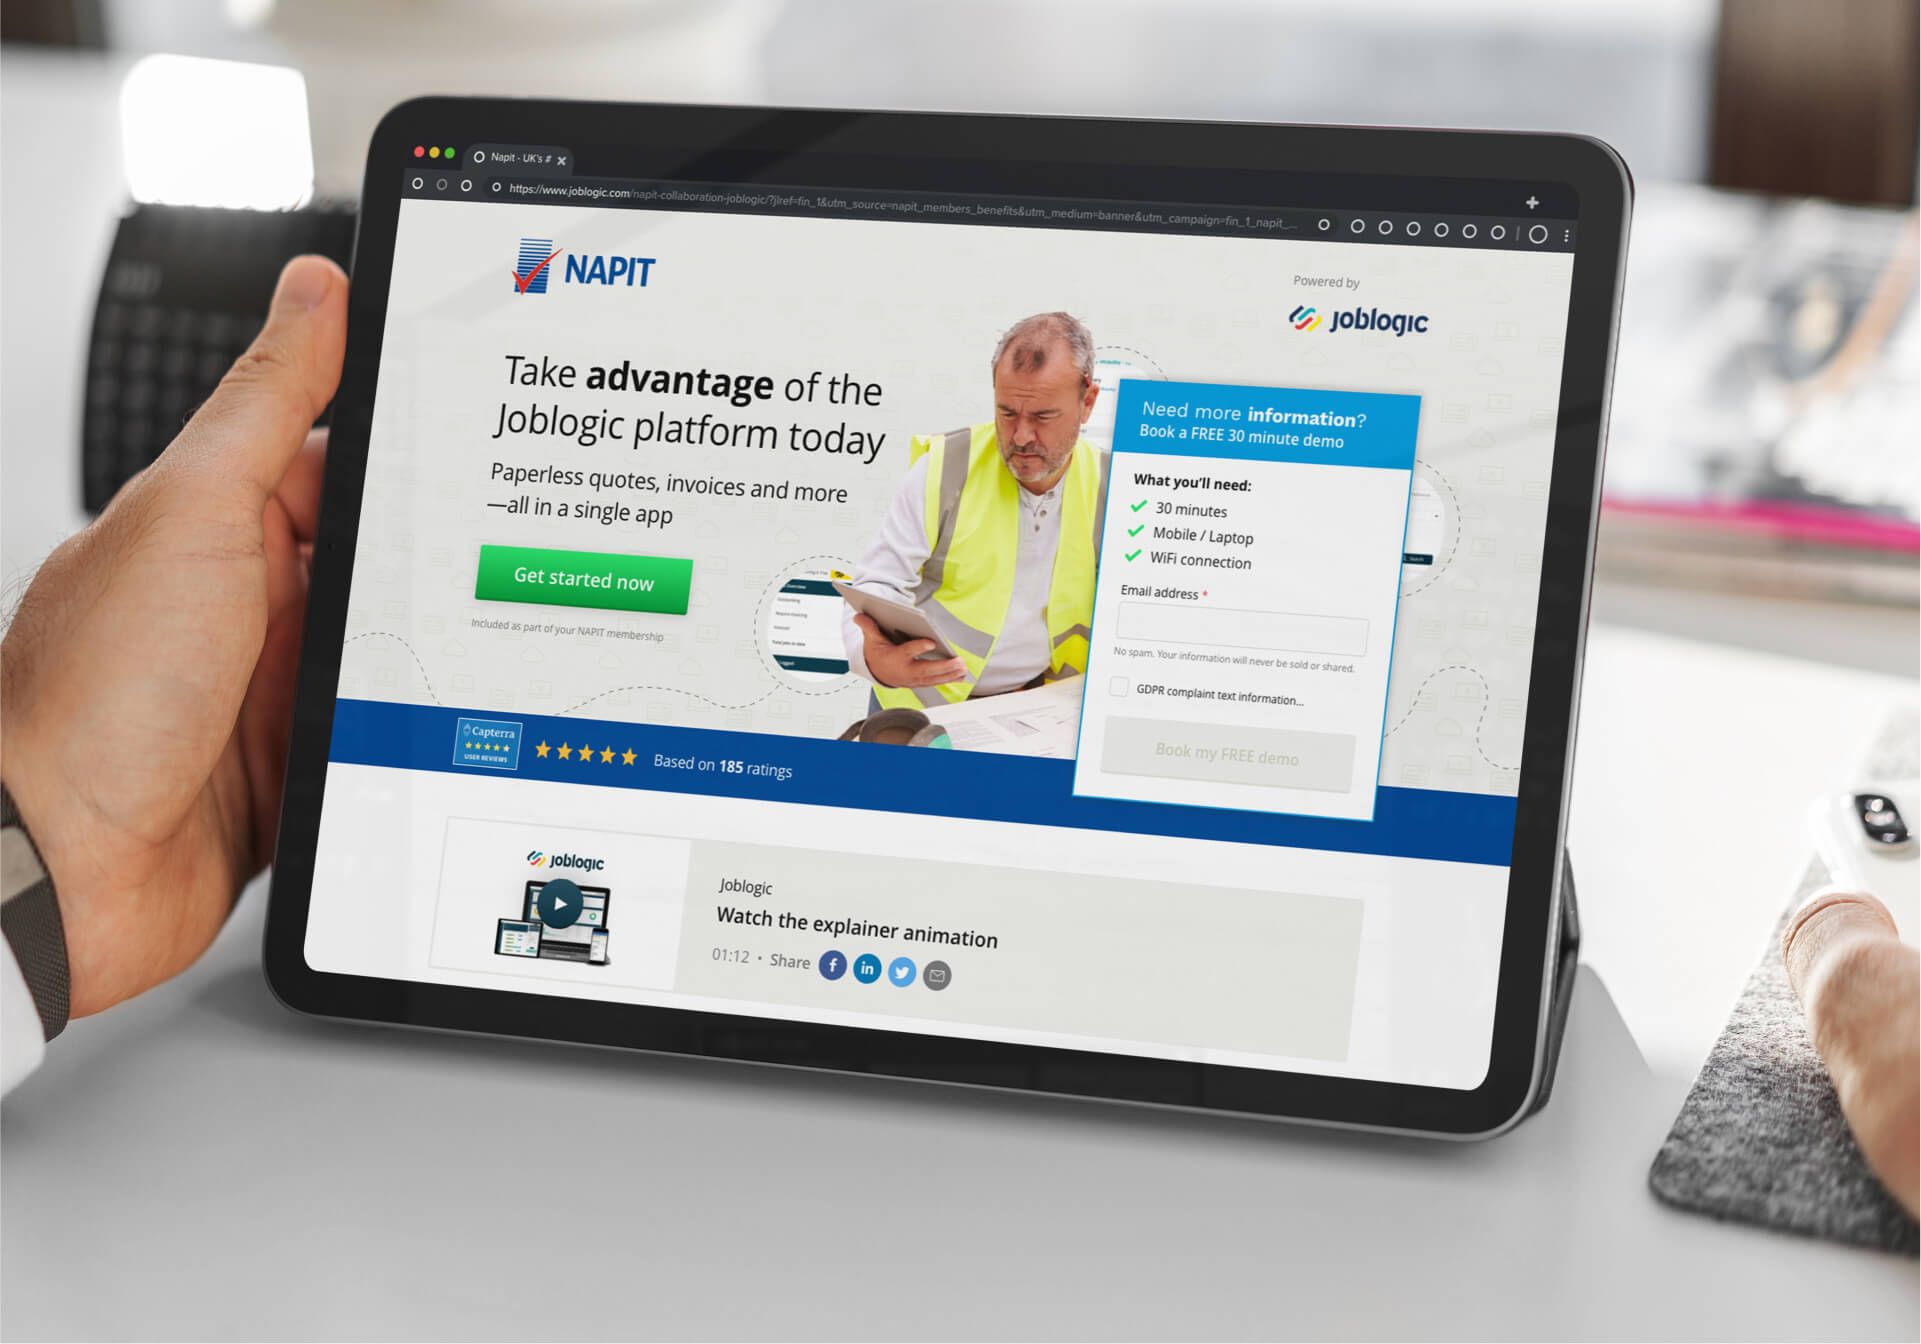
BNP Paribas
Marketing, UX and customer experience optimisation
- 2,161 leads generated with £155 spend
- 24 participants recruited for the 90-day home study
- Delivered in 100 days
- 2,161 leads generated with £155 spend
- 24 participants recruited for the 90-day home study
- Delivered in 100 days
- 2,161 leads generated with £155 spend
- 24 participants recruited for the 90-day home study
- Delivered in 100 days
- 2,161 leads generated with £155 spend
- 24 participants recruited for the 90-day home study
- Delivered in 100 days
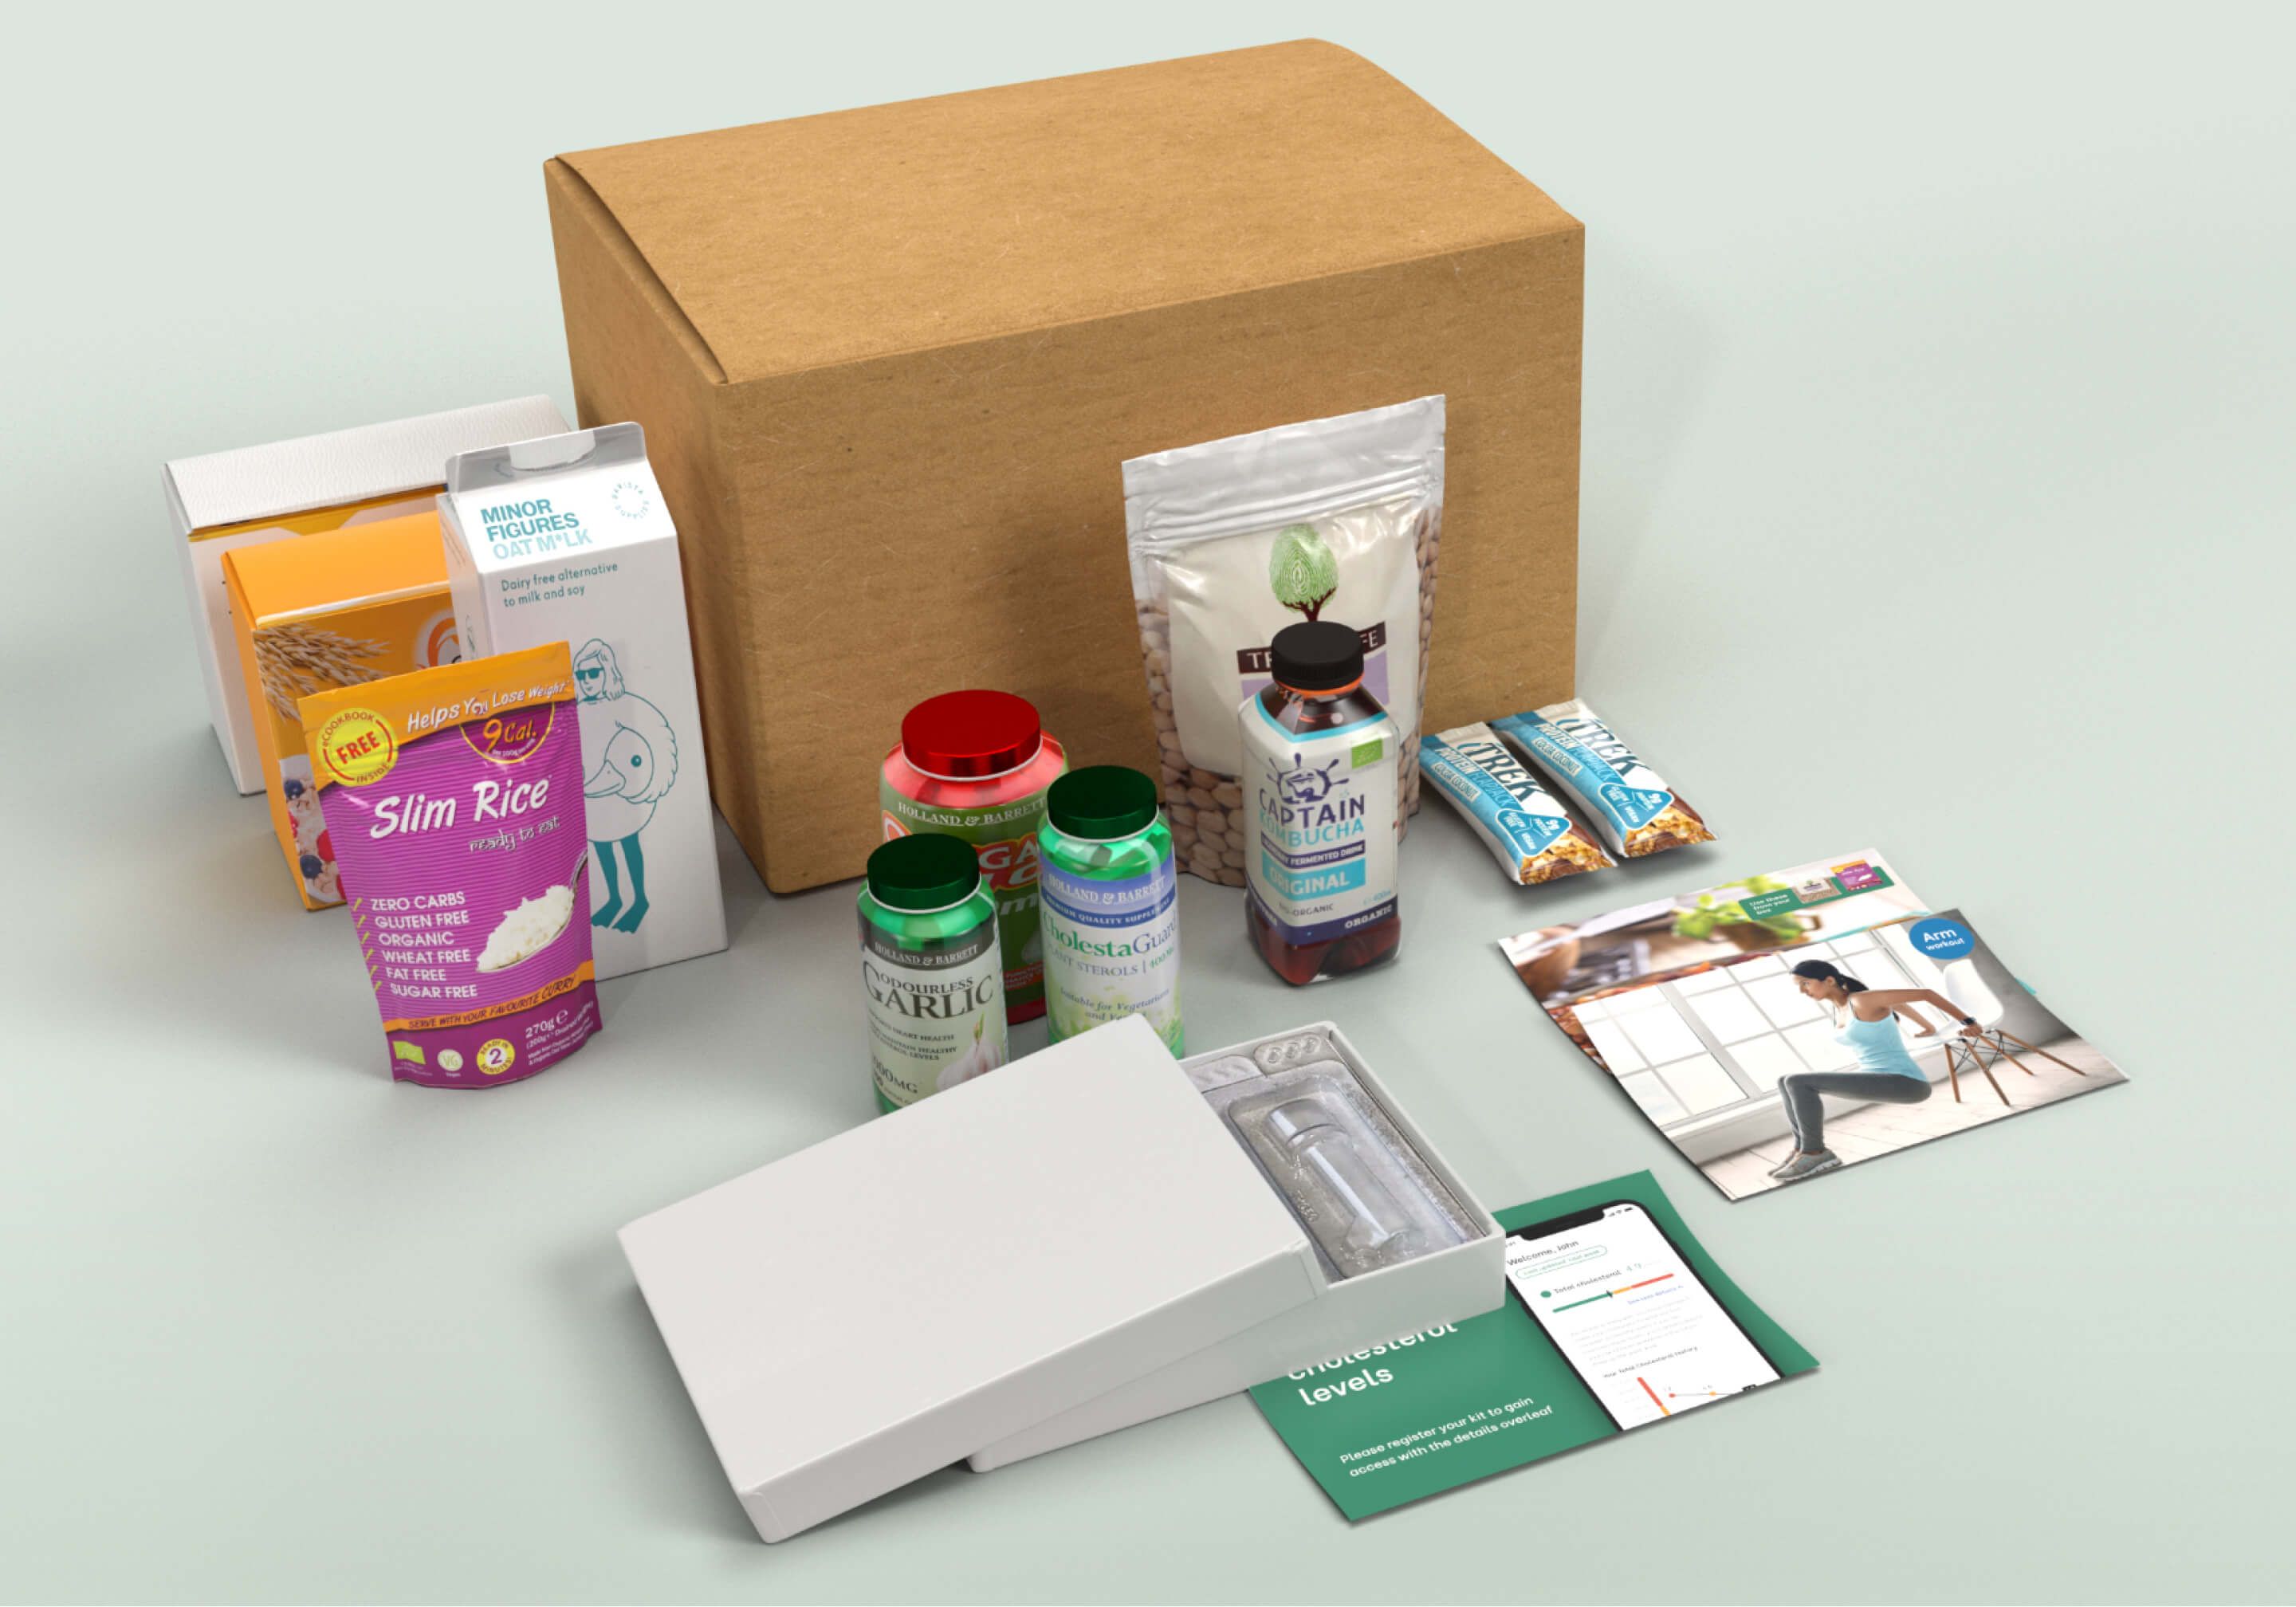
Holland & Barrett
90-day home study to validate a new market proposition
- Four core journeys tackled
- Delivered across five sprints
- Four core journeys tackled
- Delivered across five sprints
- Four core journeys tackled
- Delivered across five sprints
- Four core journeys tackled
- Delivered across five sprints
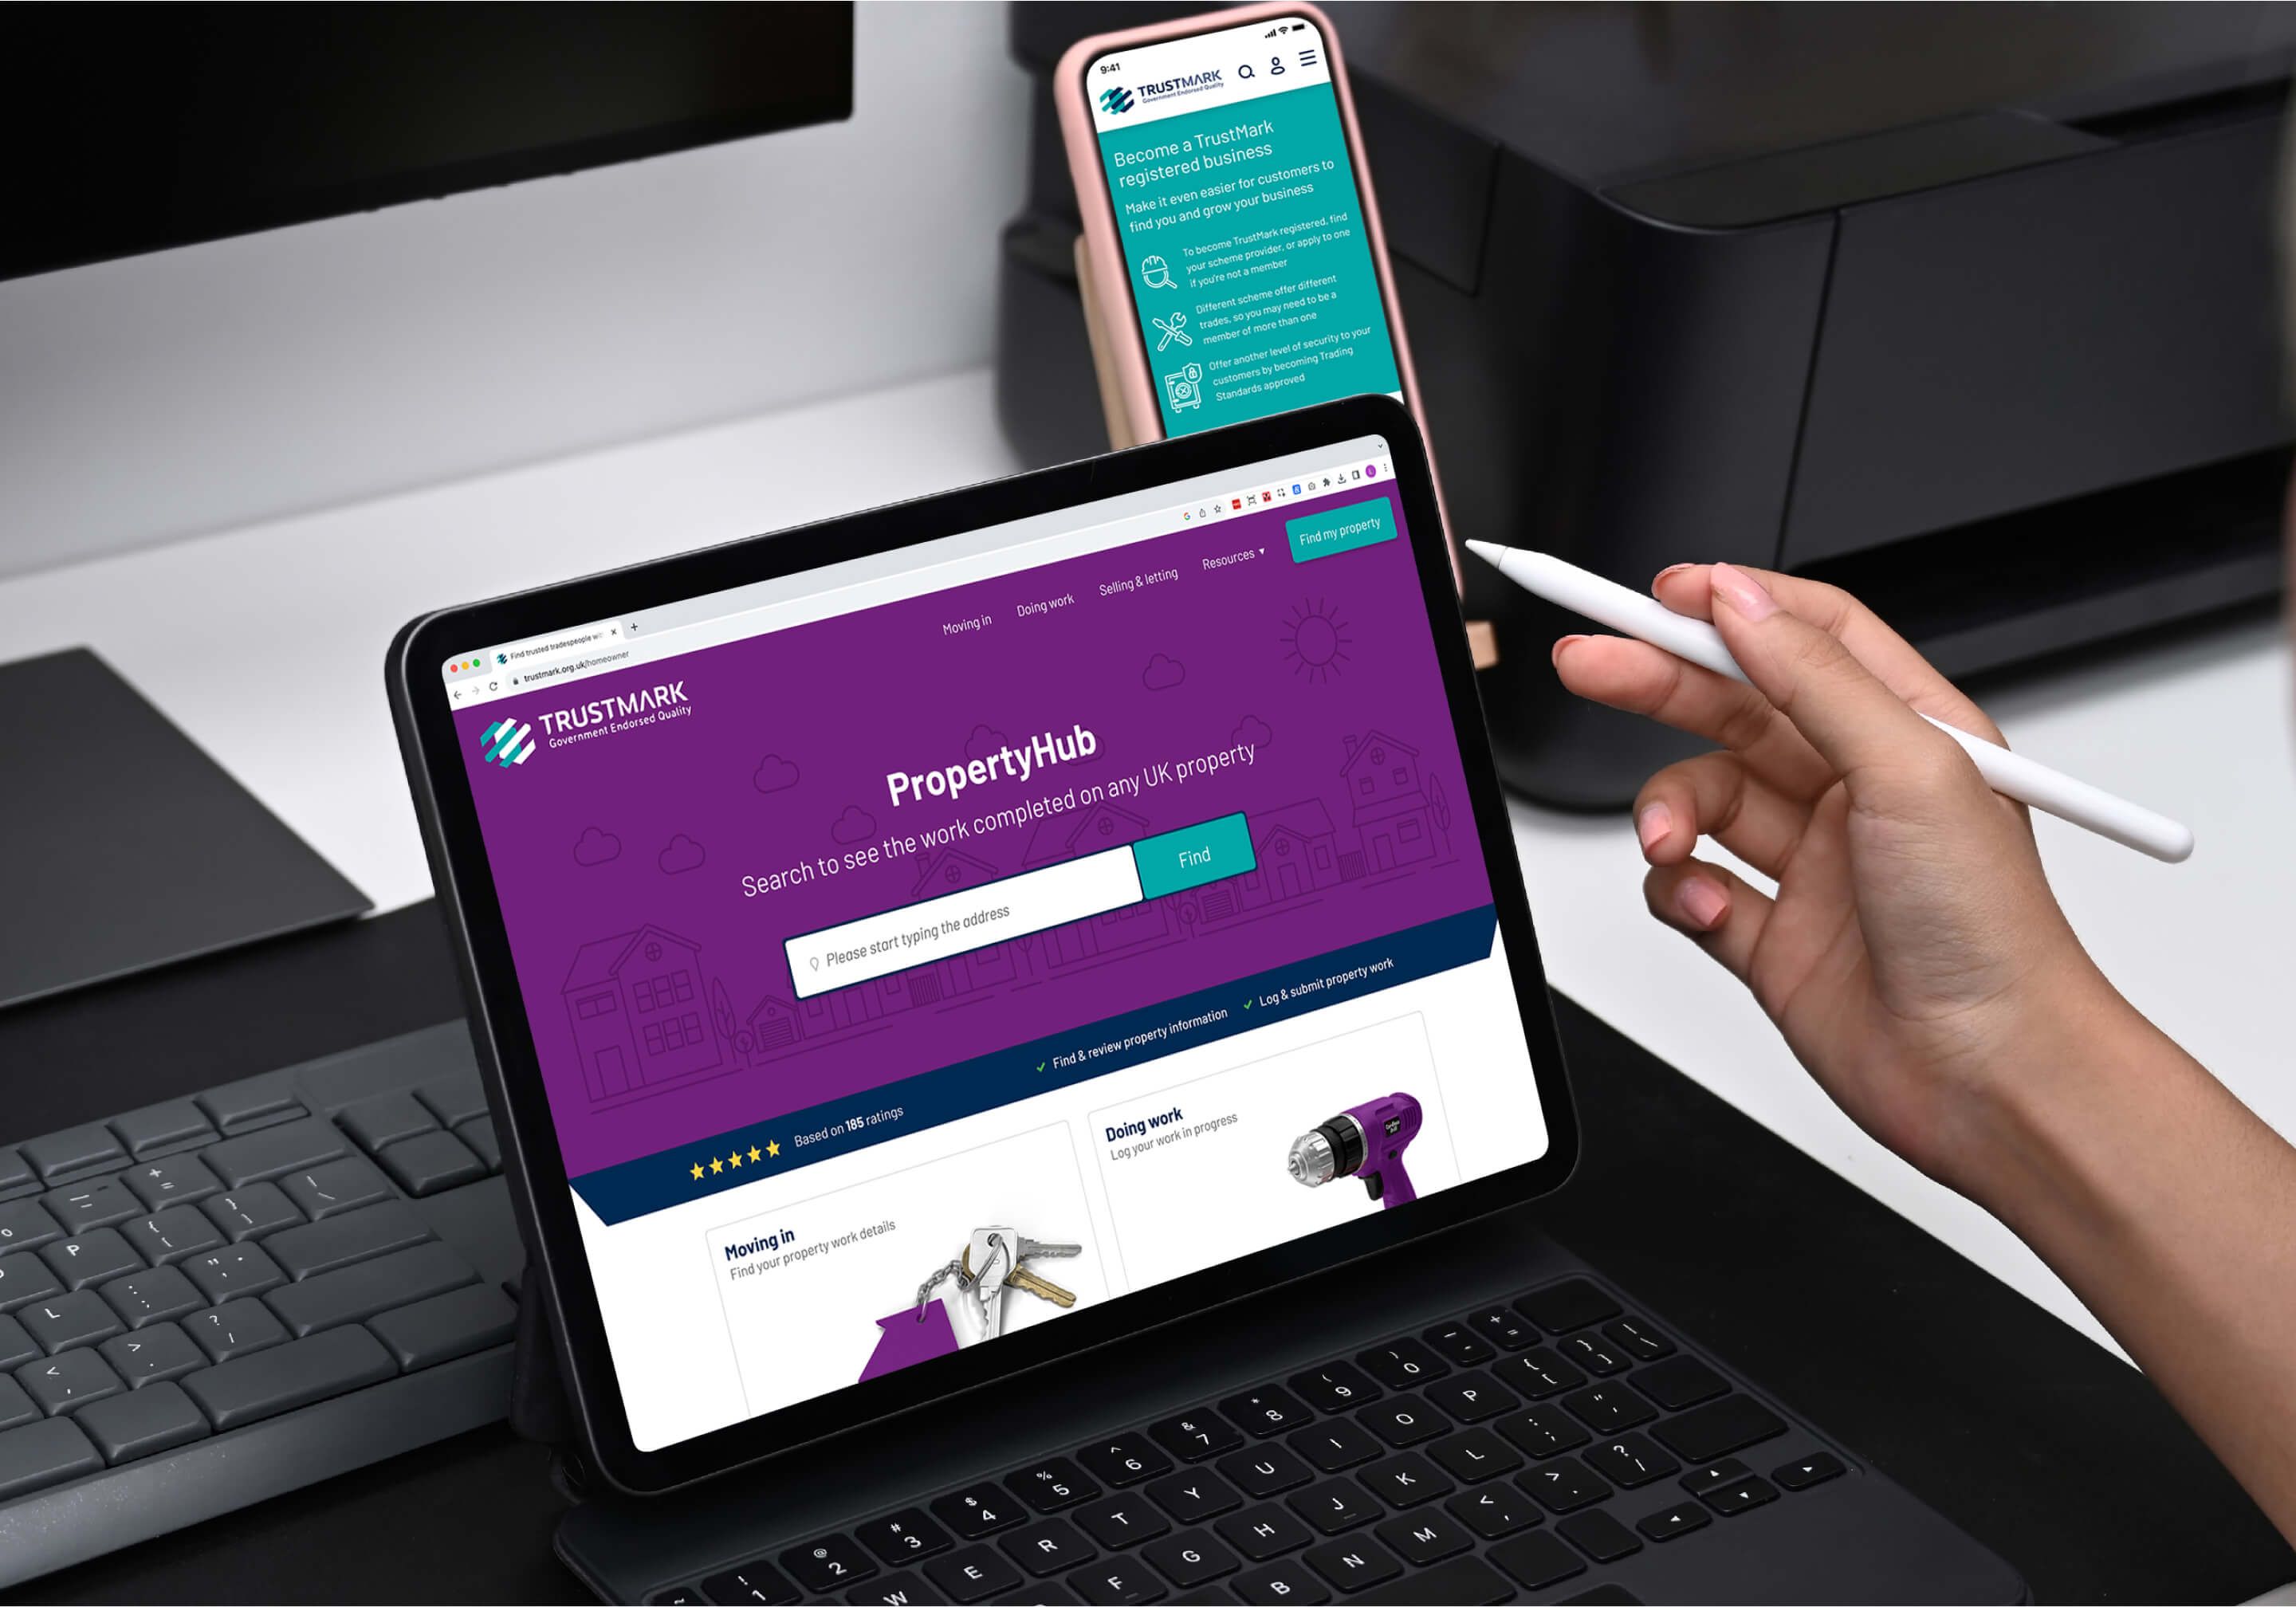
TrustMark
Trade services and digital tools
- Systematic brochureware website redesign
- Three core conversion points designed
- Delivered across three sprints
- Systematic brochureware website redesign
- Three core conversion points designed
- Delivered across three sprints
- Systematic brochureware website redesign
- Three core conversion points designed
- Delivered across three sprints
- Systematic brochureware website redesign
- Three core conversion points designed
- Delivered across three sprints
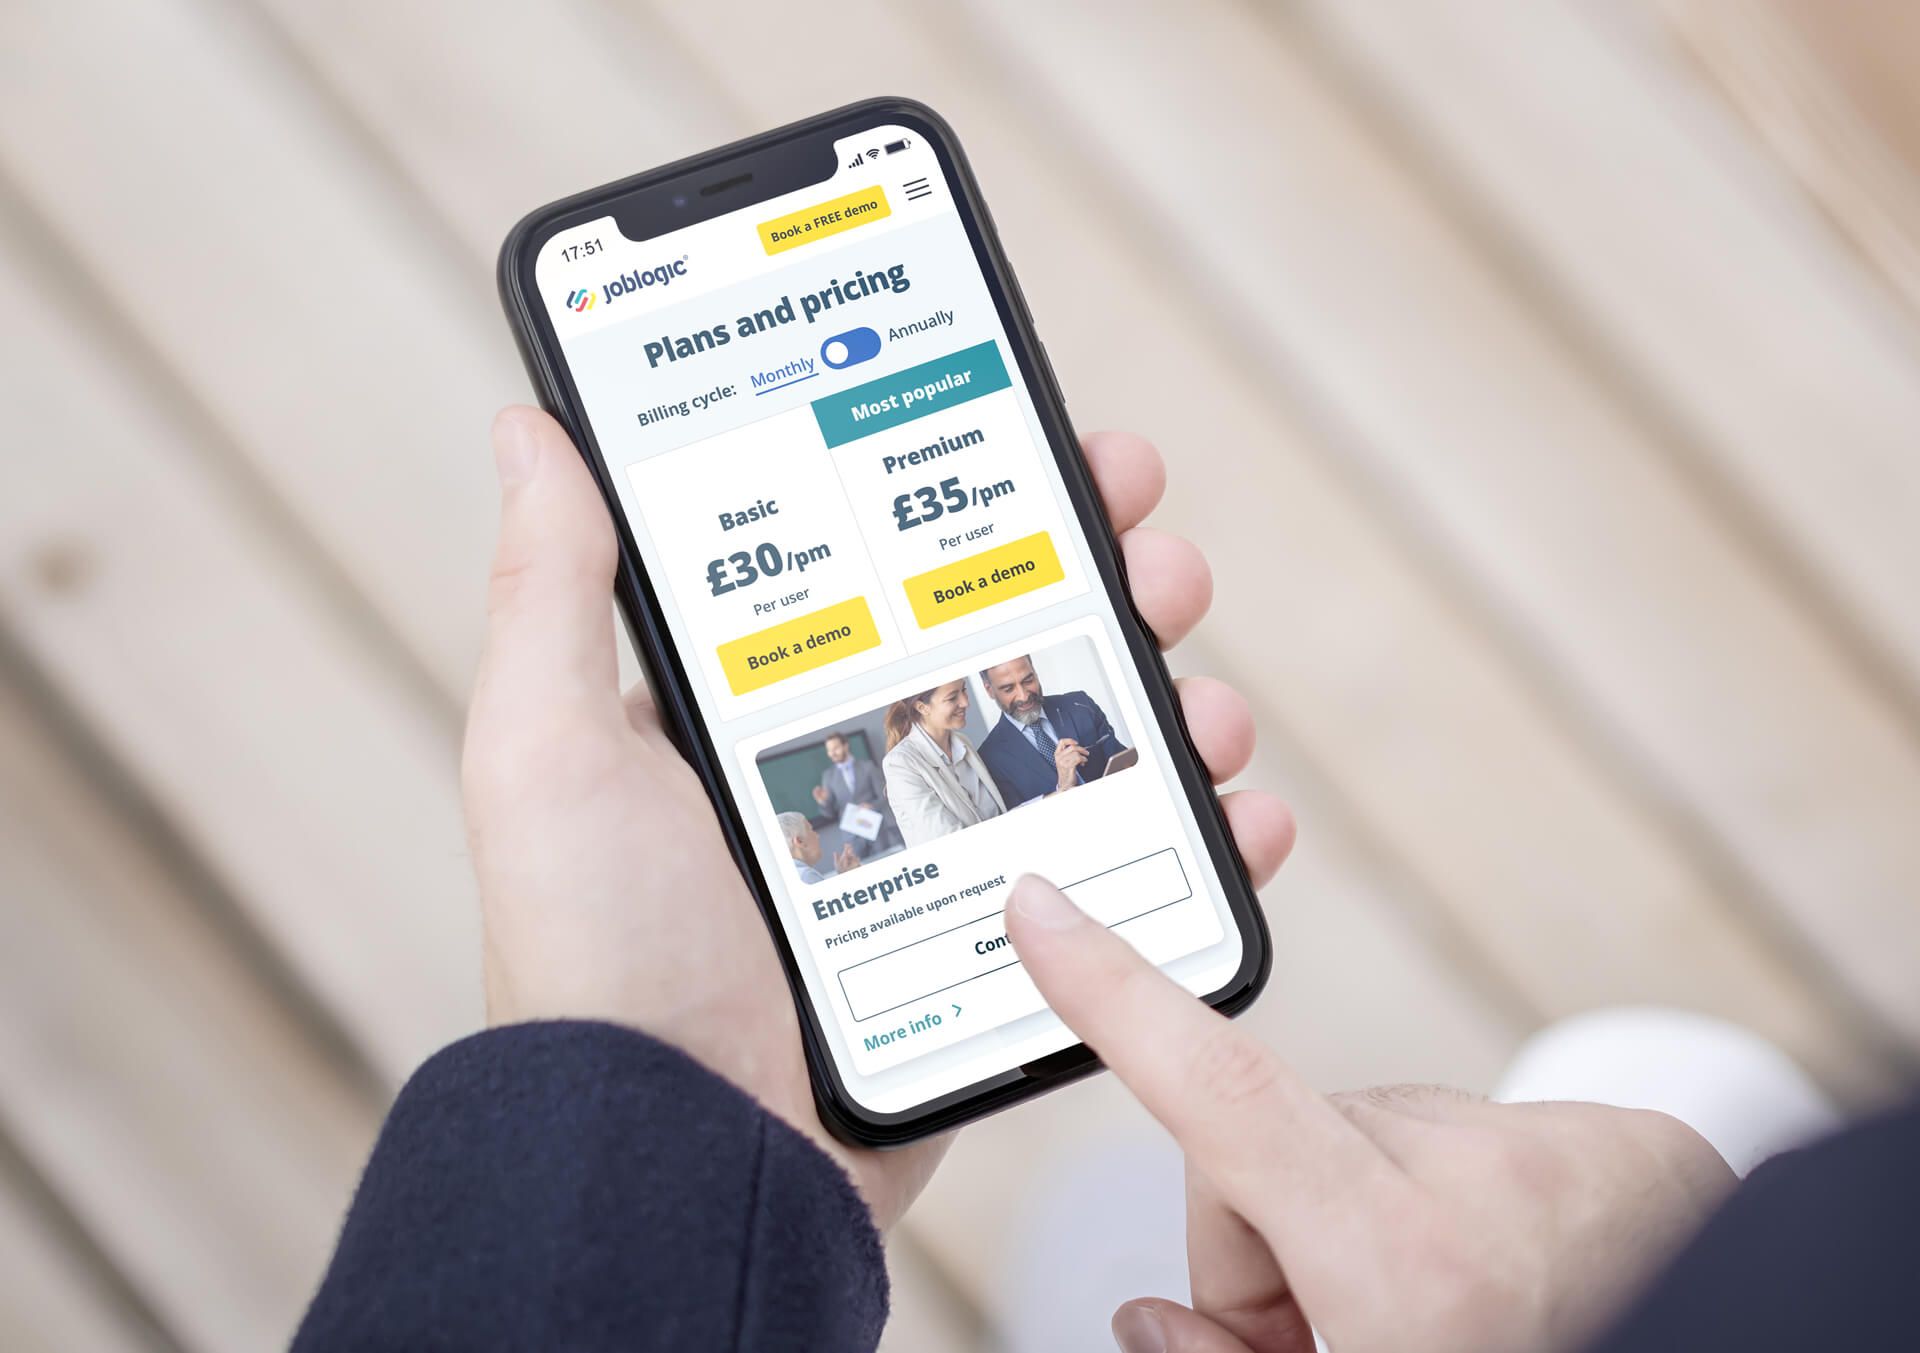
Joblogic
Designing for improved conversion