- Home
- Product Optimisation
CRO & Experimentation
Optimising your products is critical to maintain or accelerate your competitive advantage.

Our CRO & Experimentation frameworks are purposefully created to test the highest risk and reward hypotheses, formulate experiments that convert, and measure the results in real-time - ensuring we optimise the products your customers love and use daily.
Explore our CRO & Experimentation frameworks
- Delivered in 1 sprint
- 15 core recommendations made
- Experimentation-ready in 3 sprints
- Delivered in 1 sprint
- 15 core recommendations made
- Experimentation-ready in 3 sprints
- Delivered in 1 sprint
- 15 core recommendations made
- Experimentation-ready in 3 sprints
- Delivered in 1 sprint
- 15 core recommendations made
- Experimentation-ready in 3 sprints

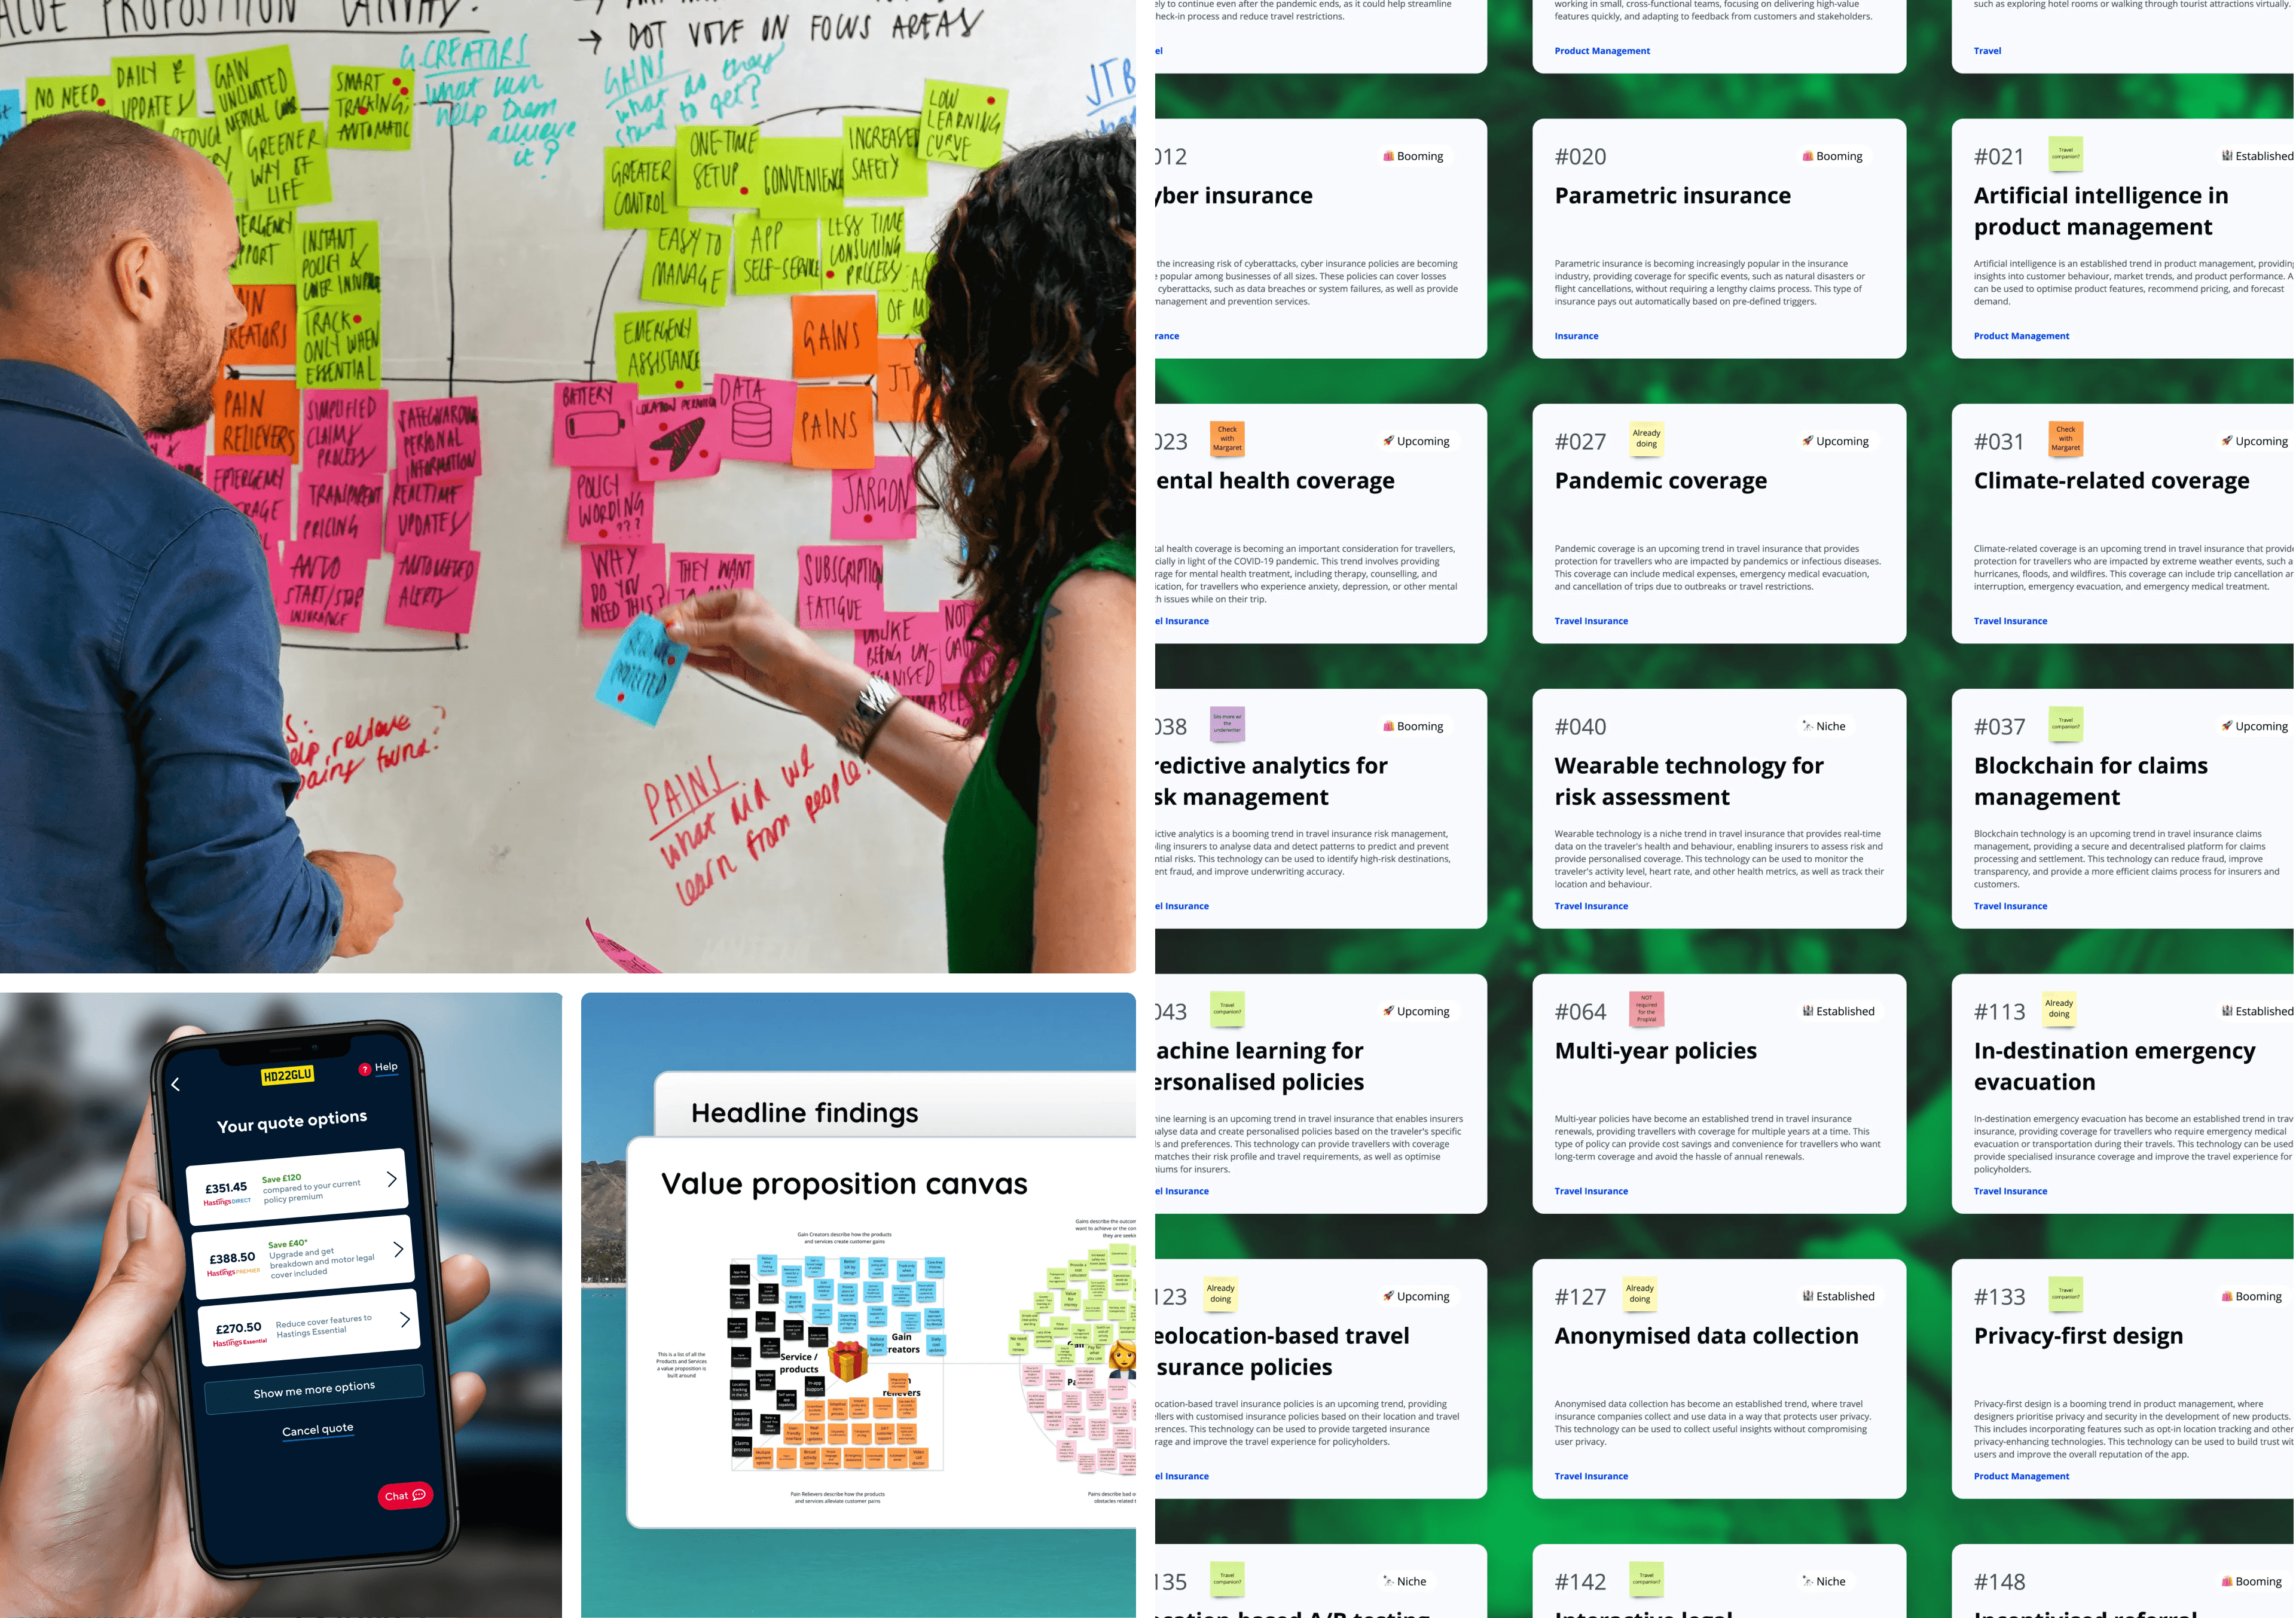
Readiness
Assessment 🔍
Analyse your organisation’s position to experiment with digital products and the changes required to do so.
- 41 experiment candidates identified
- 128 events IDs created for tracking
- Delivered in 1 sprint
- 41 experiment candidates identified
- 128 events IDs created for tracking
- Delivered in 1 sprint
- 41 experiment candidates identified
- 128 events IDs created for tracking
- Delivered in 1 sprint
- 41 experiment candidates identified
- 128 events IDs created for tracking
- Delivered in 1 sprint
Experience
Review🚦
A digital product and service health check that reveals an actionable backlog of experiment recommendations.
- MoM conversion rate of 6.9%
- LFL quarterly revenue of £265K
- Measurement period of 6 sprints
- MoM conversion rate of 6.9%
- LFL quarterly revenue of £265K
- Measurement period of 6 sprints
- MoM conversion rate of 6.9%
- LFL quarterly revenue of £265K
- Measurement period of 6 sprints
- MoM conversion rate of 6.9%
- LFL quarterly revenue of £265K
- Measurement period of 6 sprints
Experiment
Sprints 🧪
Test hypotheses, validate multi-variate solutions, and drive key metrics through experimentation at scale.
Clients love using our CRO
& Experimentation frameworks
- MoM conversion rate of 6.9%
- LFL quarterly revenue of £265K
- MoM conversion rate of 6.9%
- LFL quarterly revenue of £265K
- MoM conversion rate of 6.9%
- LFL quarterly revenue of £265K
- MoM conversion rate of 6.9%
- LFL quarterly revenue of £265K

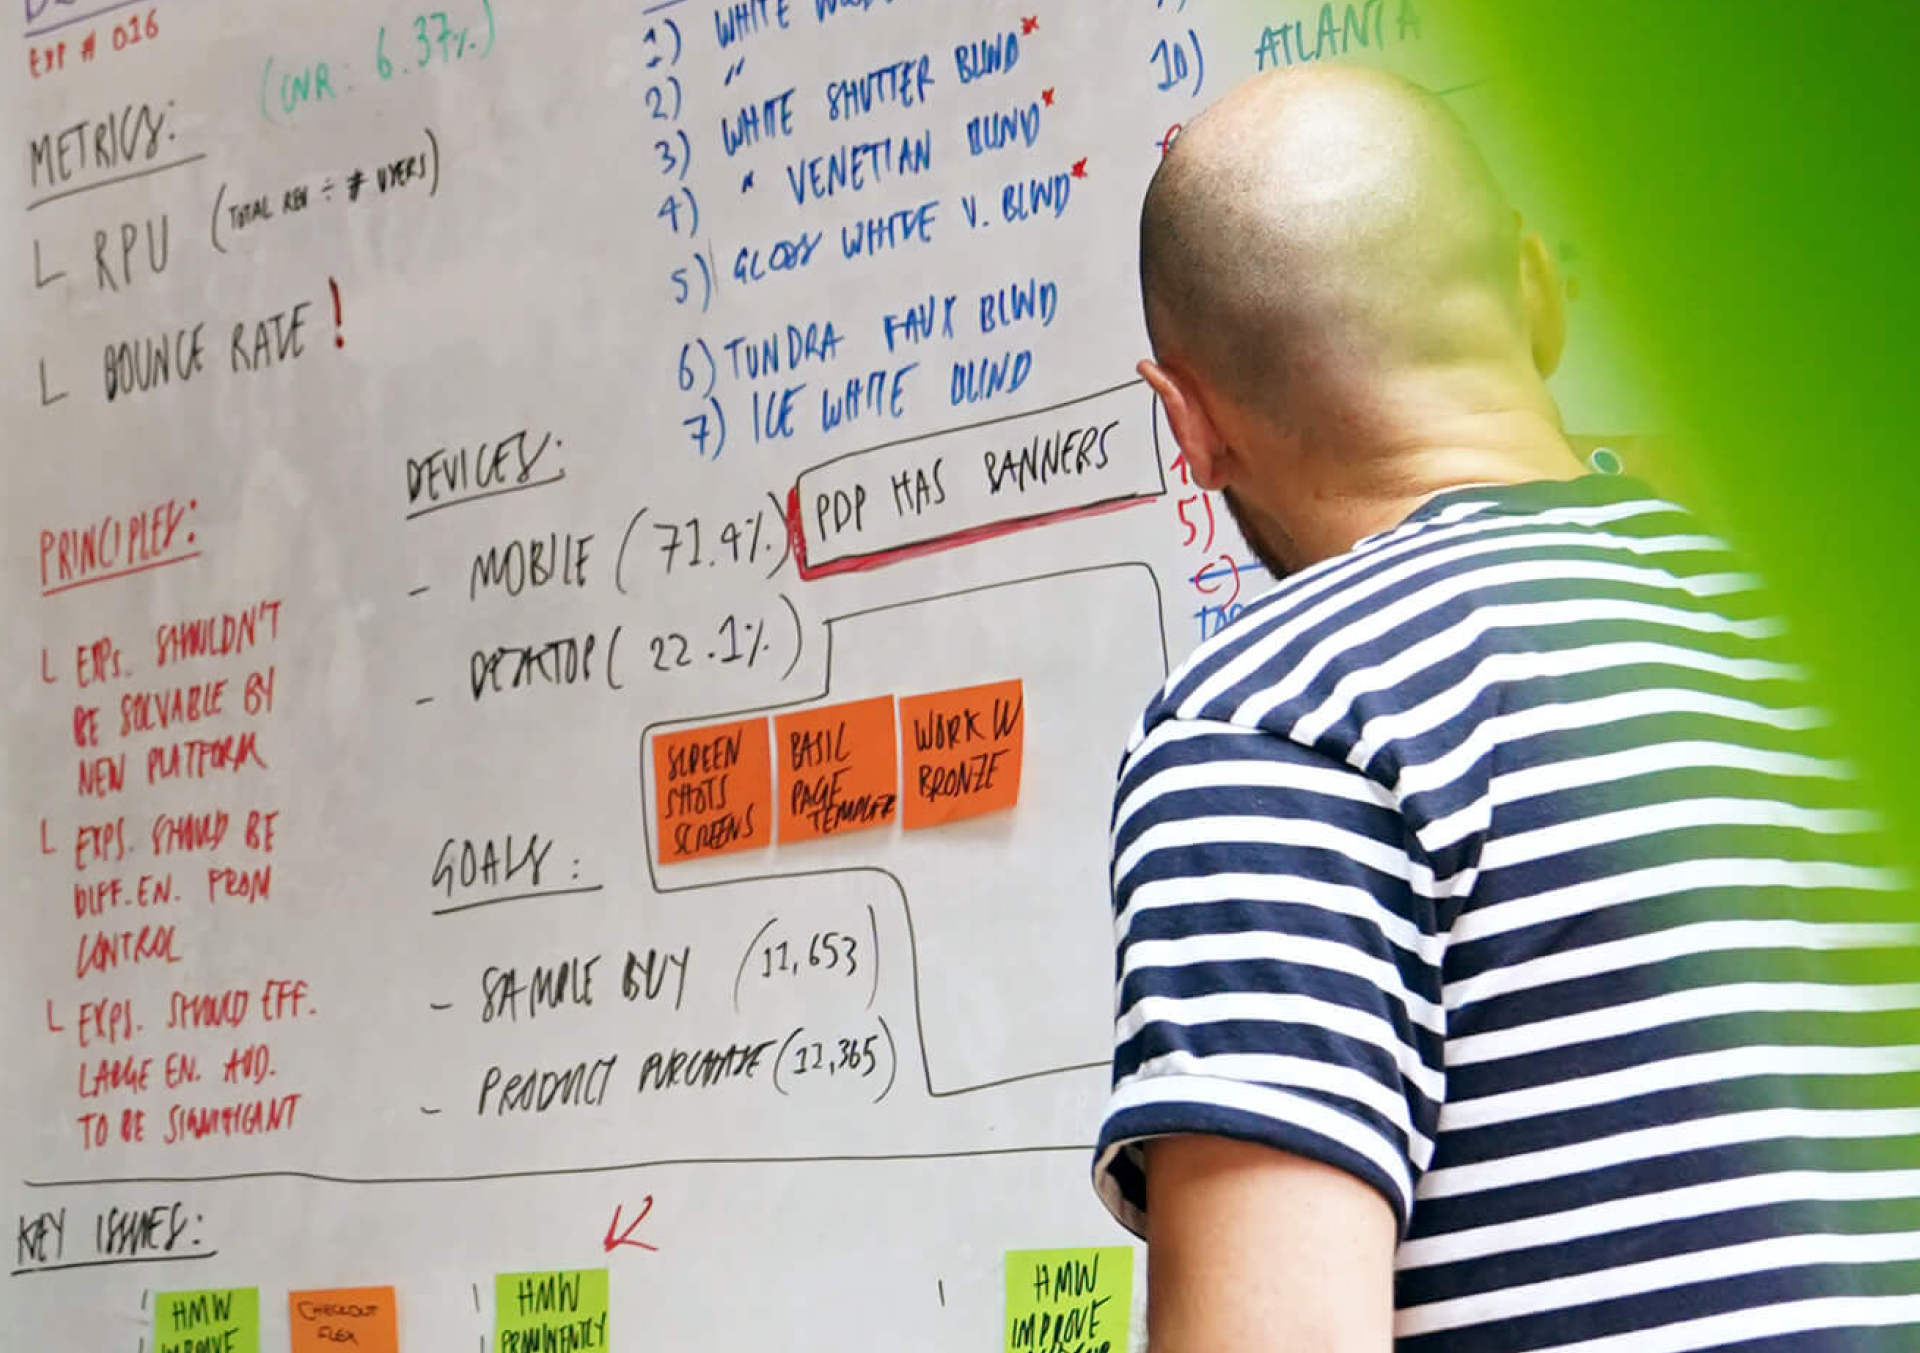
Hafele UK
Profitability through continual optimisation
- 41 experiment candidates identified
- 128 events IDs created for tracking
- Delivered in 2-weeks
- 41 experiment candidates identified
- 128 events IDs created for tracking
- Delivered in 2-weeks
- 41 experiment candidates identified
- 128 events IDs created for tracking
- Delivered in 2-weeks
- 41 experiment candidates identified
- 128 events IDs created for tracking
- Delivered in 2-weeks
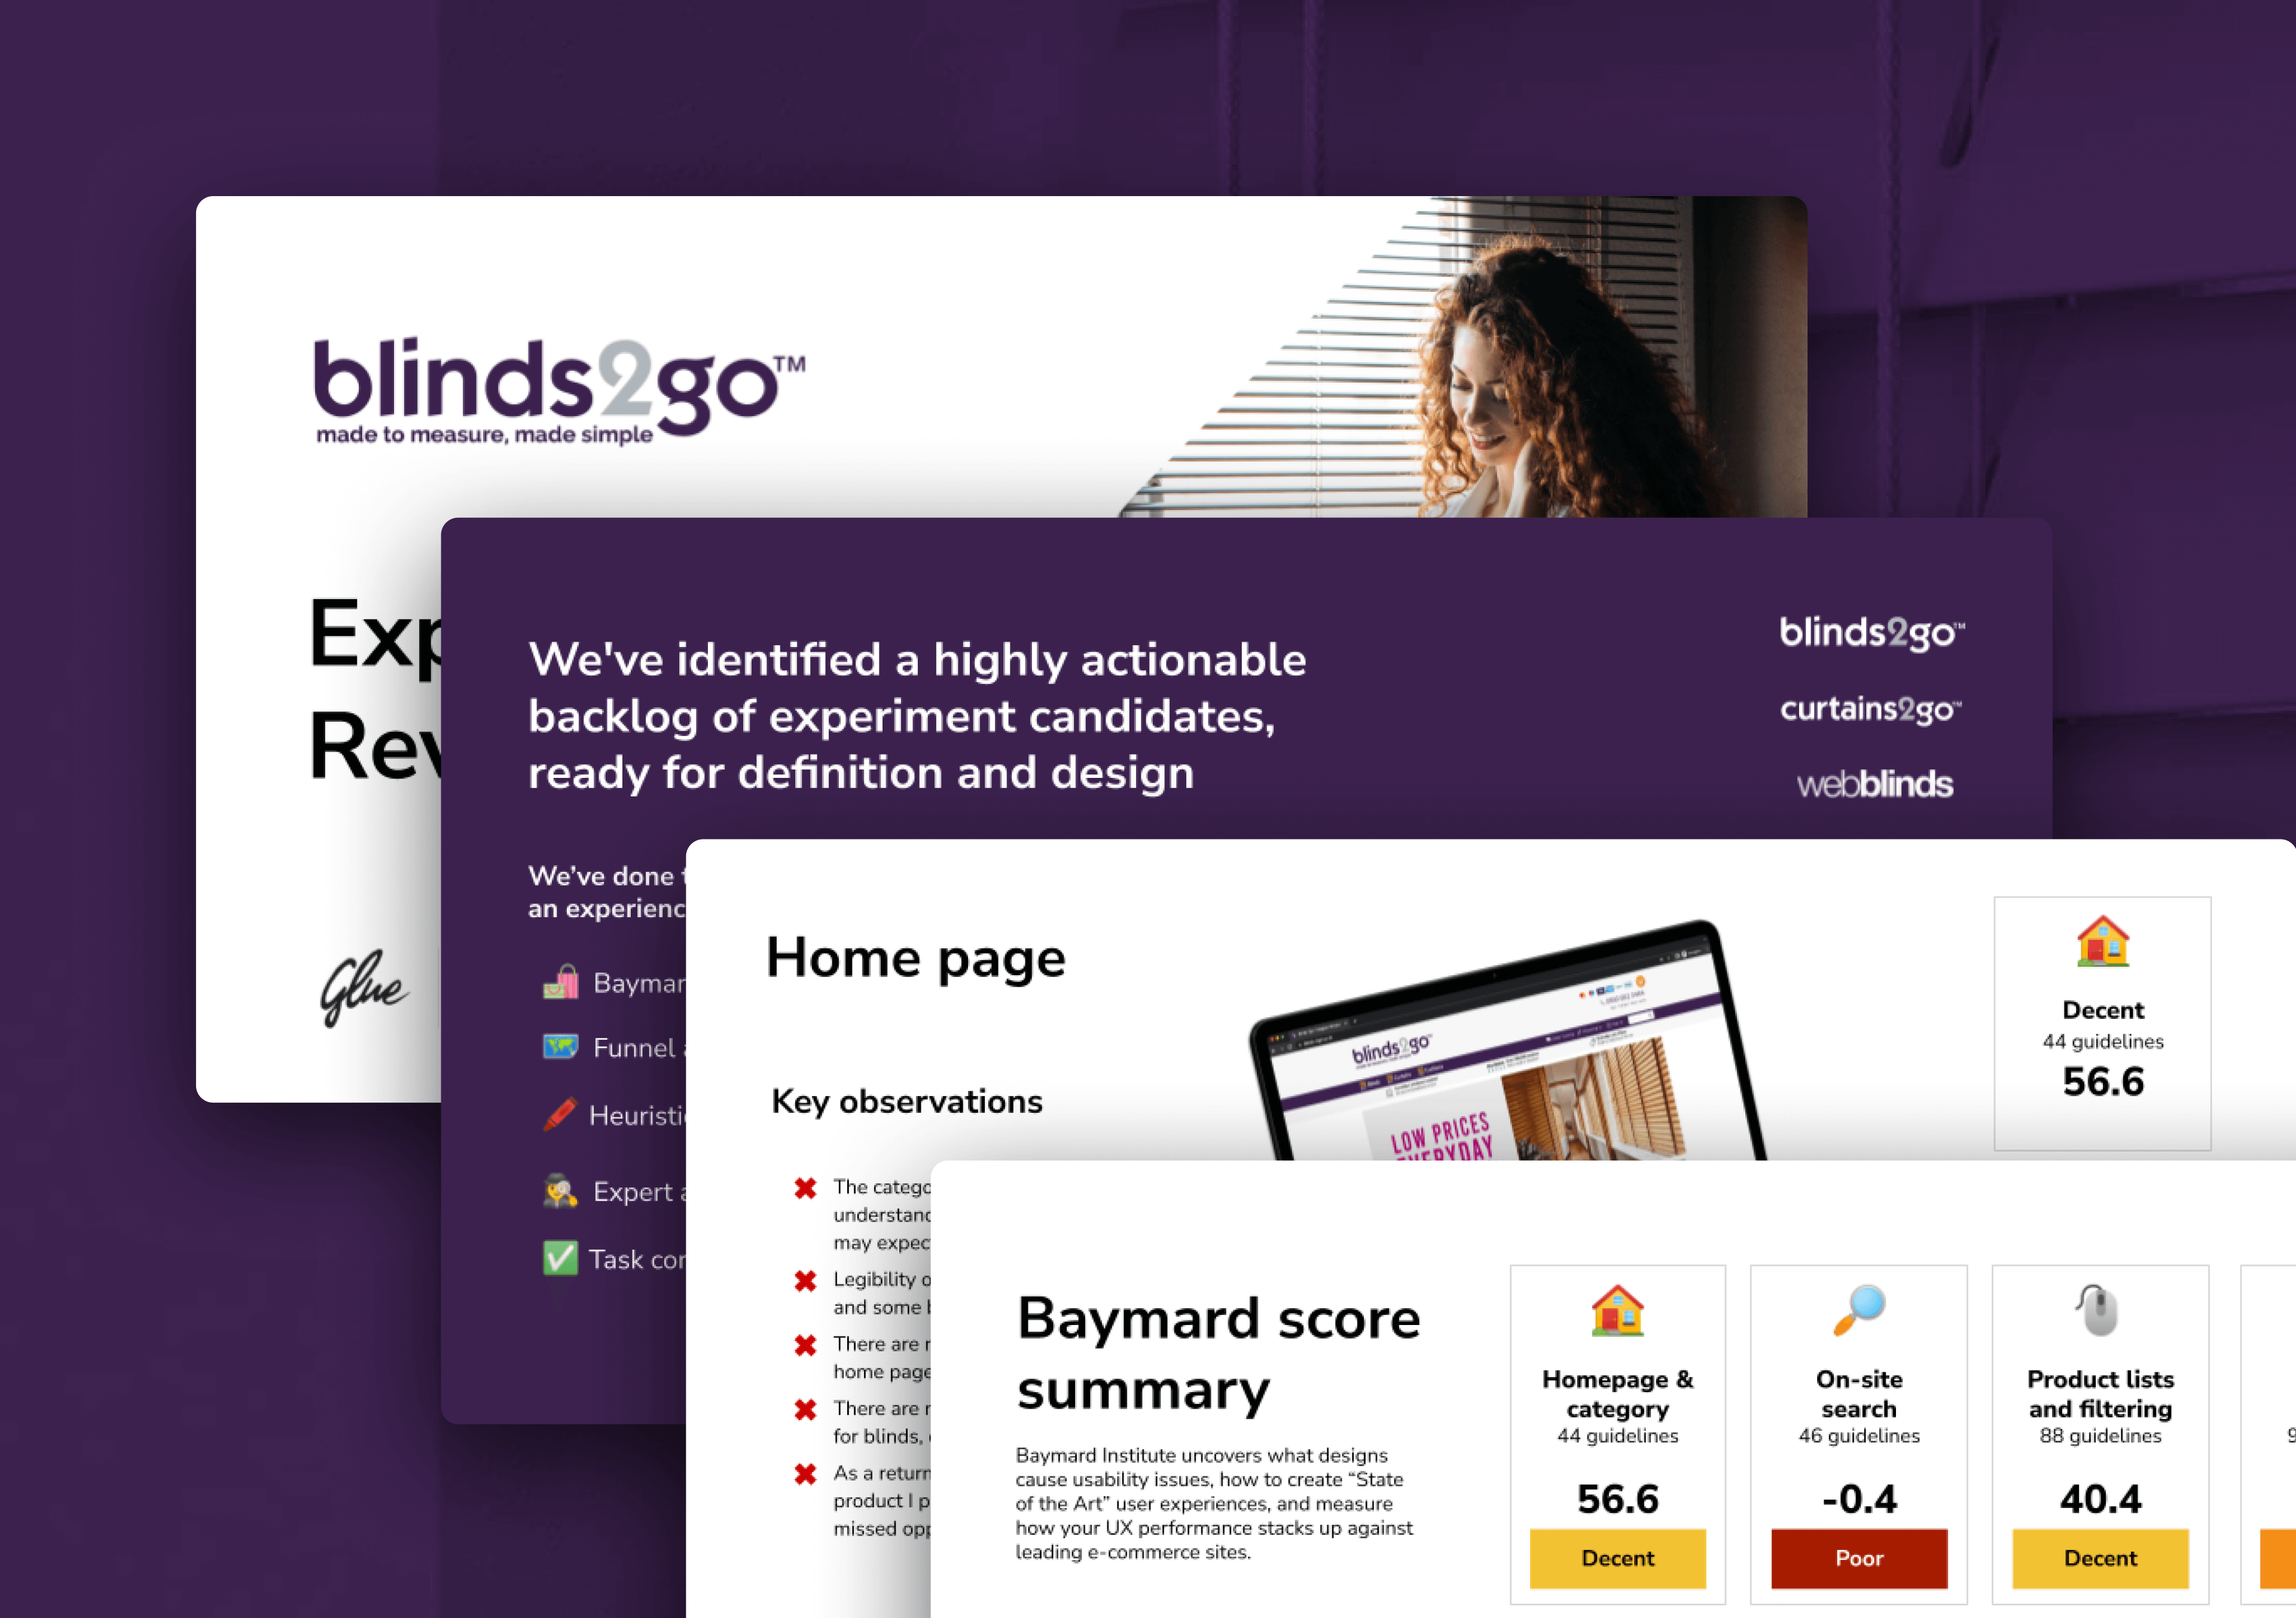
Blinds2Go
Experiment backlog identification
- 41 defects uncovered
- 14 opportunities identified
- Delivered in 1 sprint
- 41 defects uncovered
- 14 opportunities identified
- Delivered in 1 sprint
- 41 defects uncovered
- 14 opportunities identified
- Delivered in 1 sprint
- 41 defects uncovered
- 14 opportunities identified
- Delivered in 1 sprint
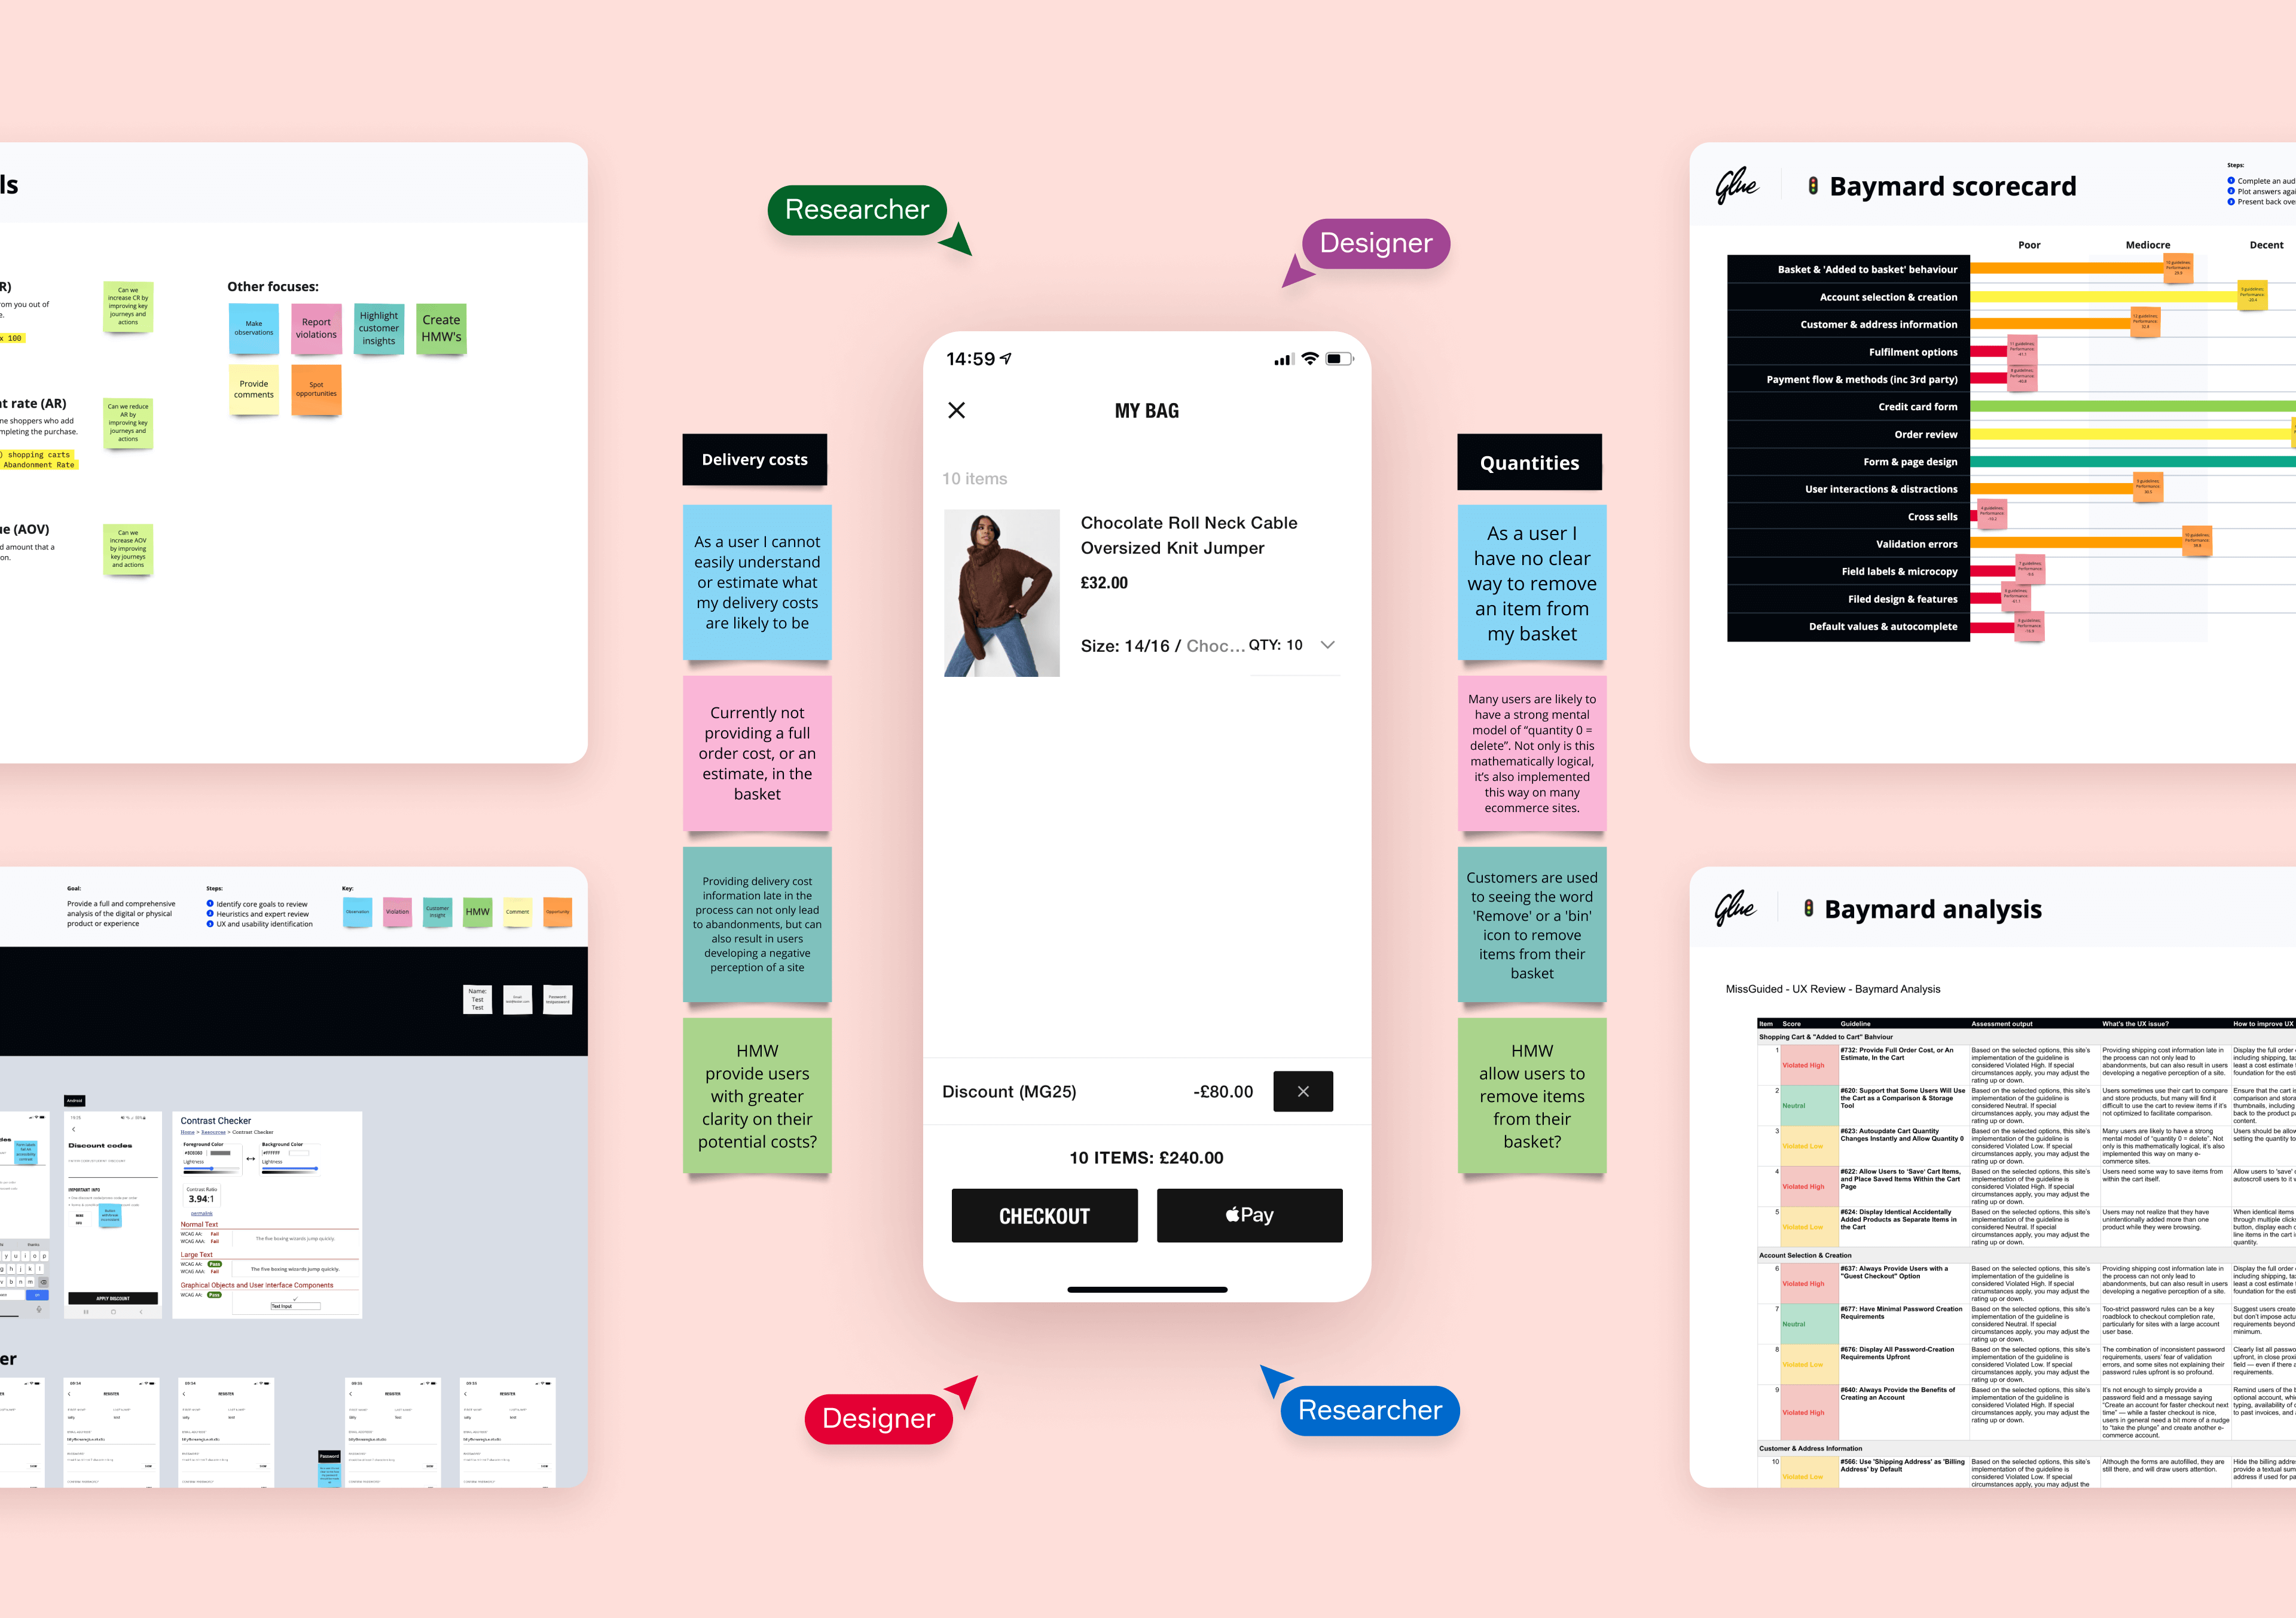
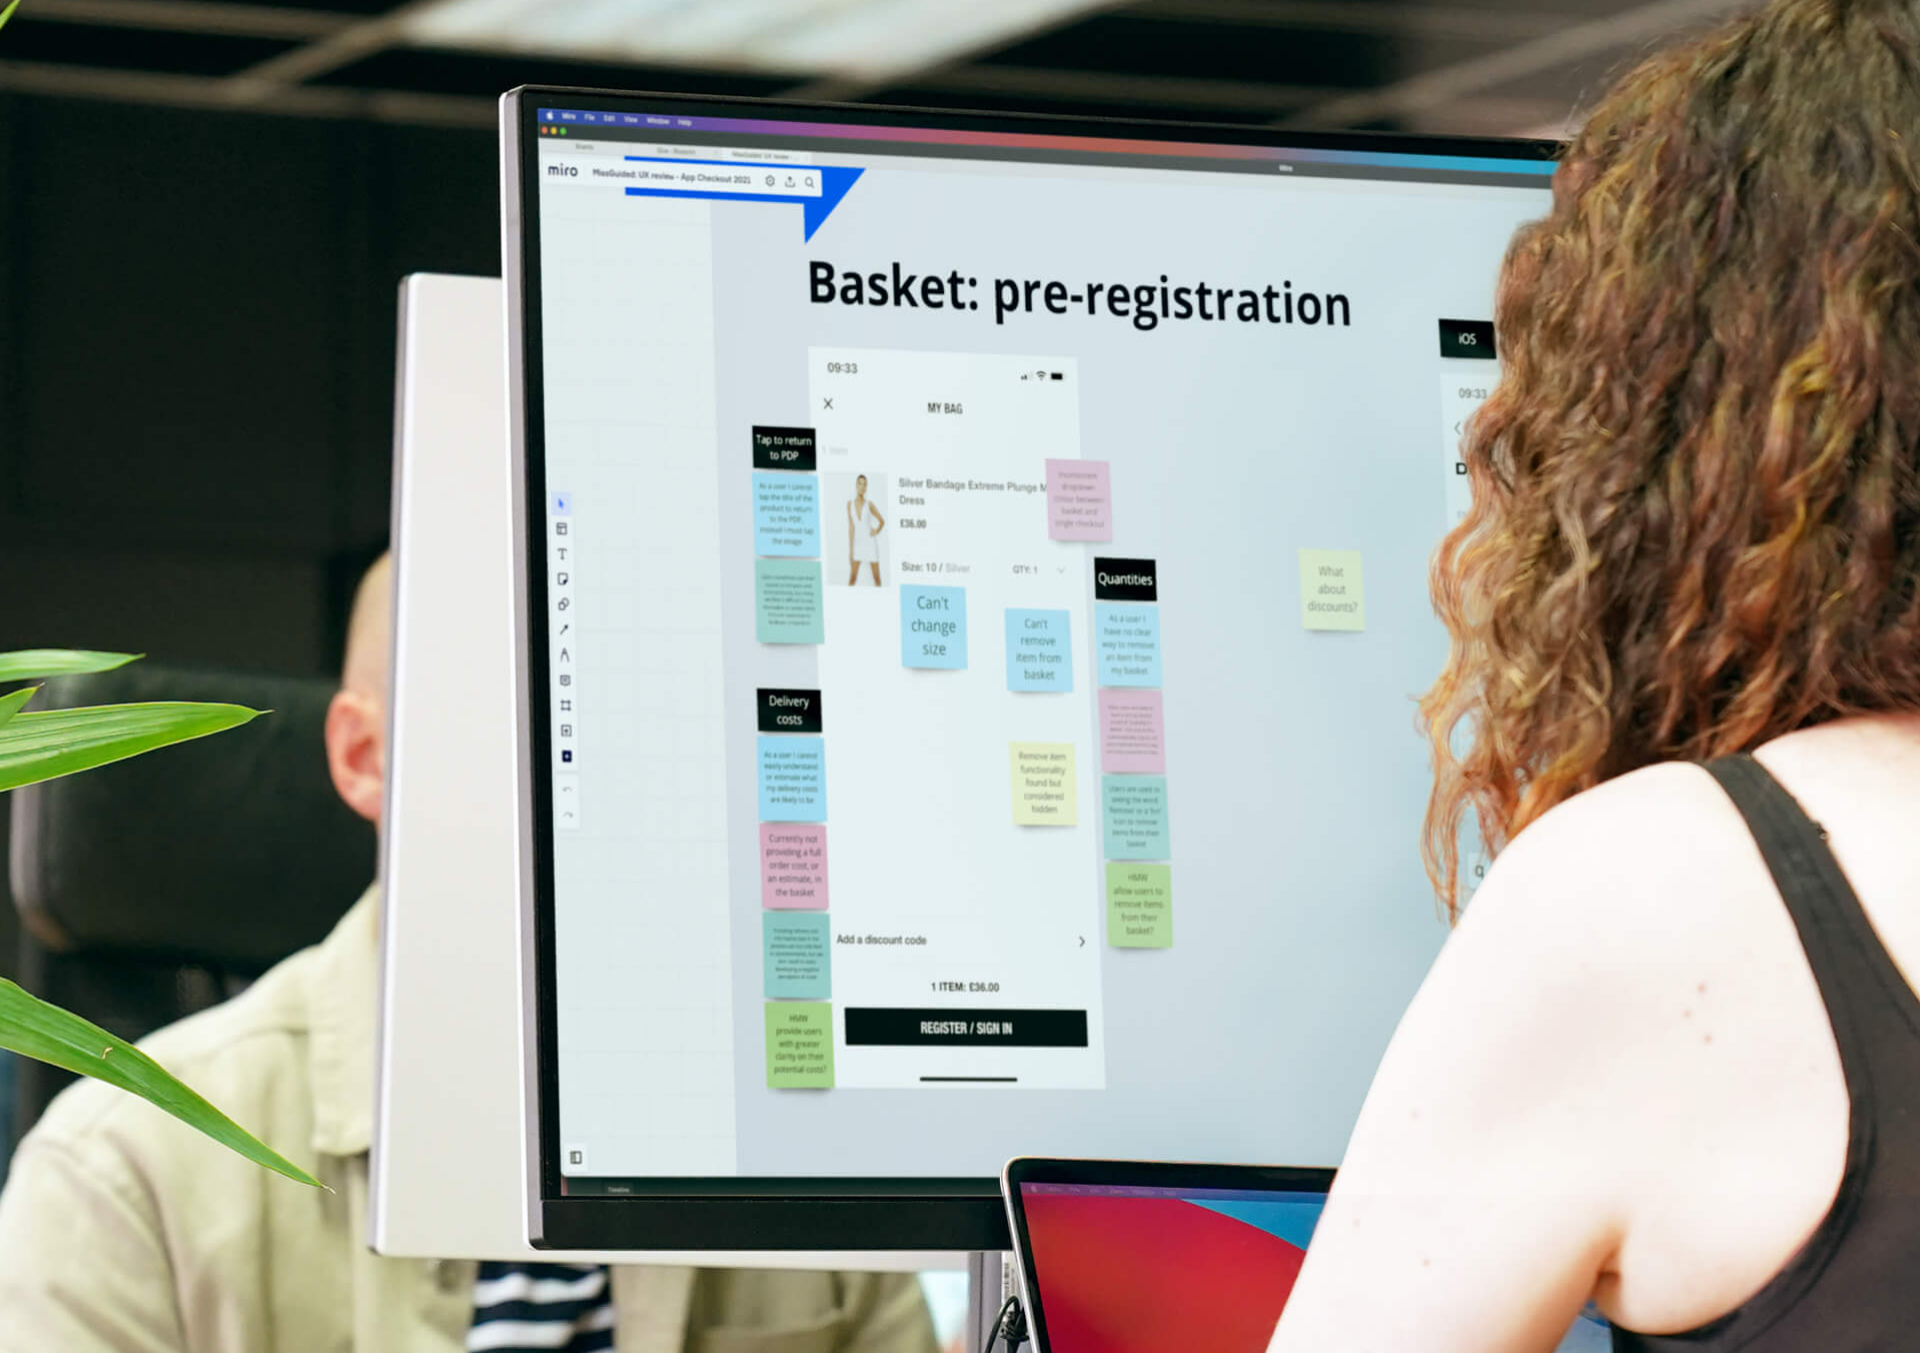
Missguided
Qualifying a product backlog for action
- 11 experiments executed
- Conducted over 12 sprints
- Measurement period of 6 sprints
- 11 experiments executed
- Conducted over 12 sprints
- Measurement period of 6 sprints
- 11 experiments executed
- Conducted over 12 sprints
- Measurement period of 6 sprints
- 11 experiments executed
- Conducted over 12 sprints
- Measurement period of 6 sprints
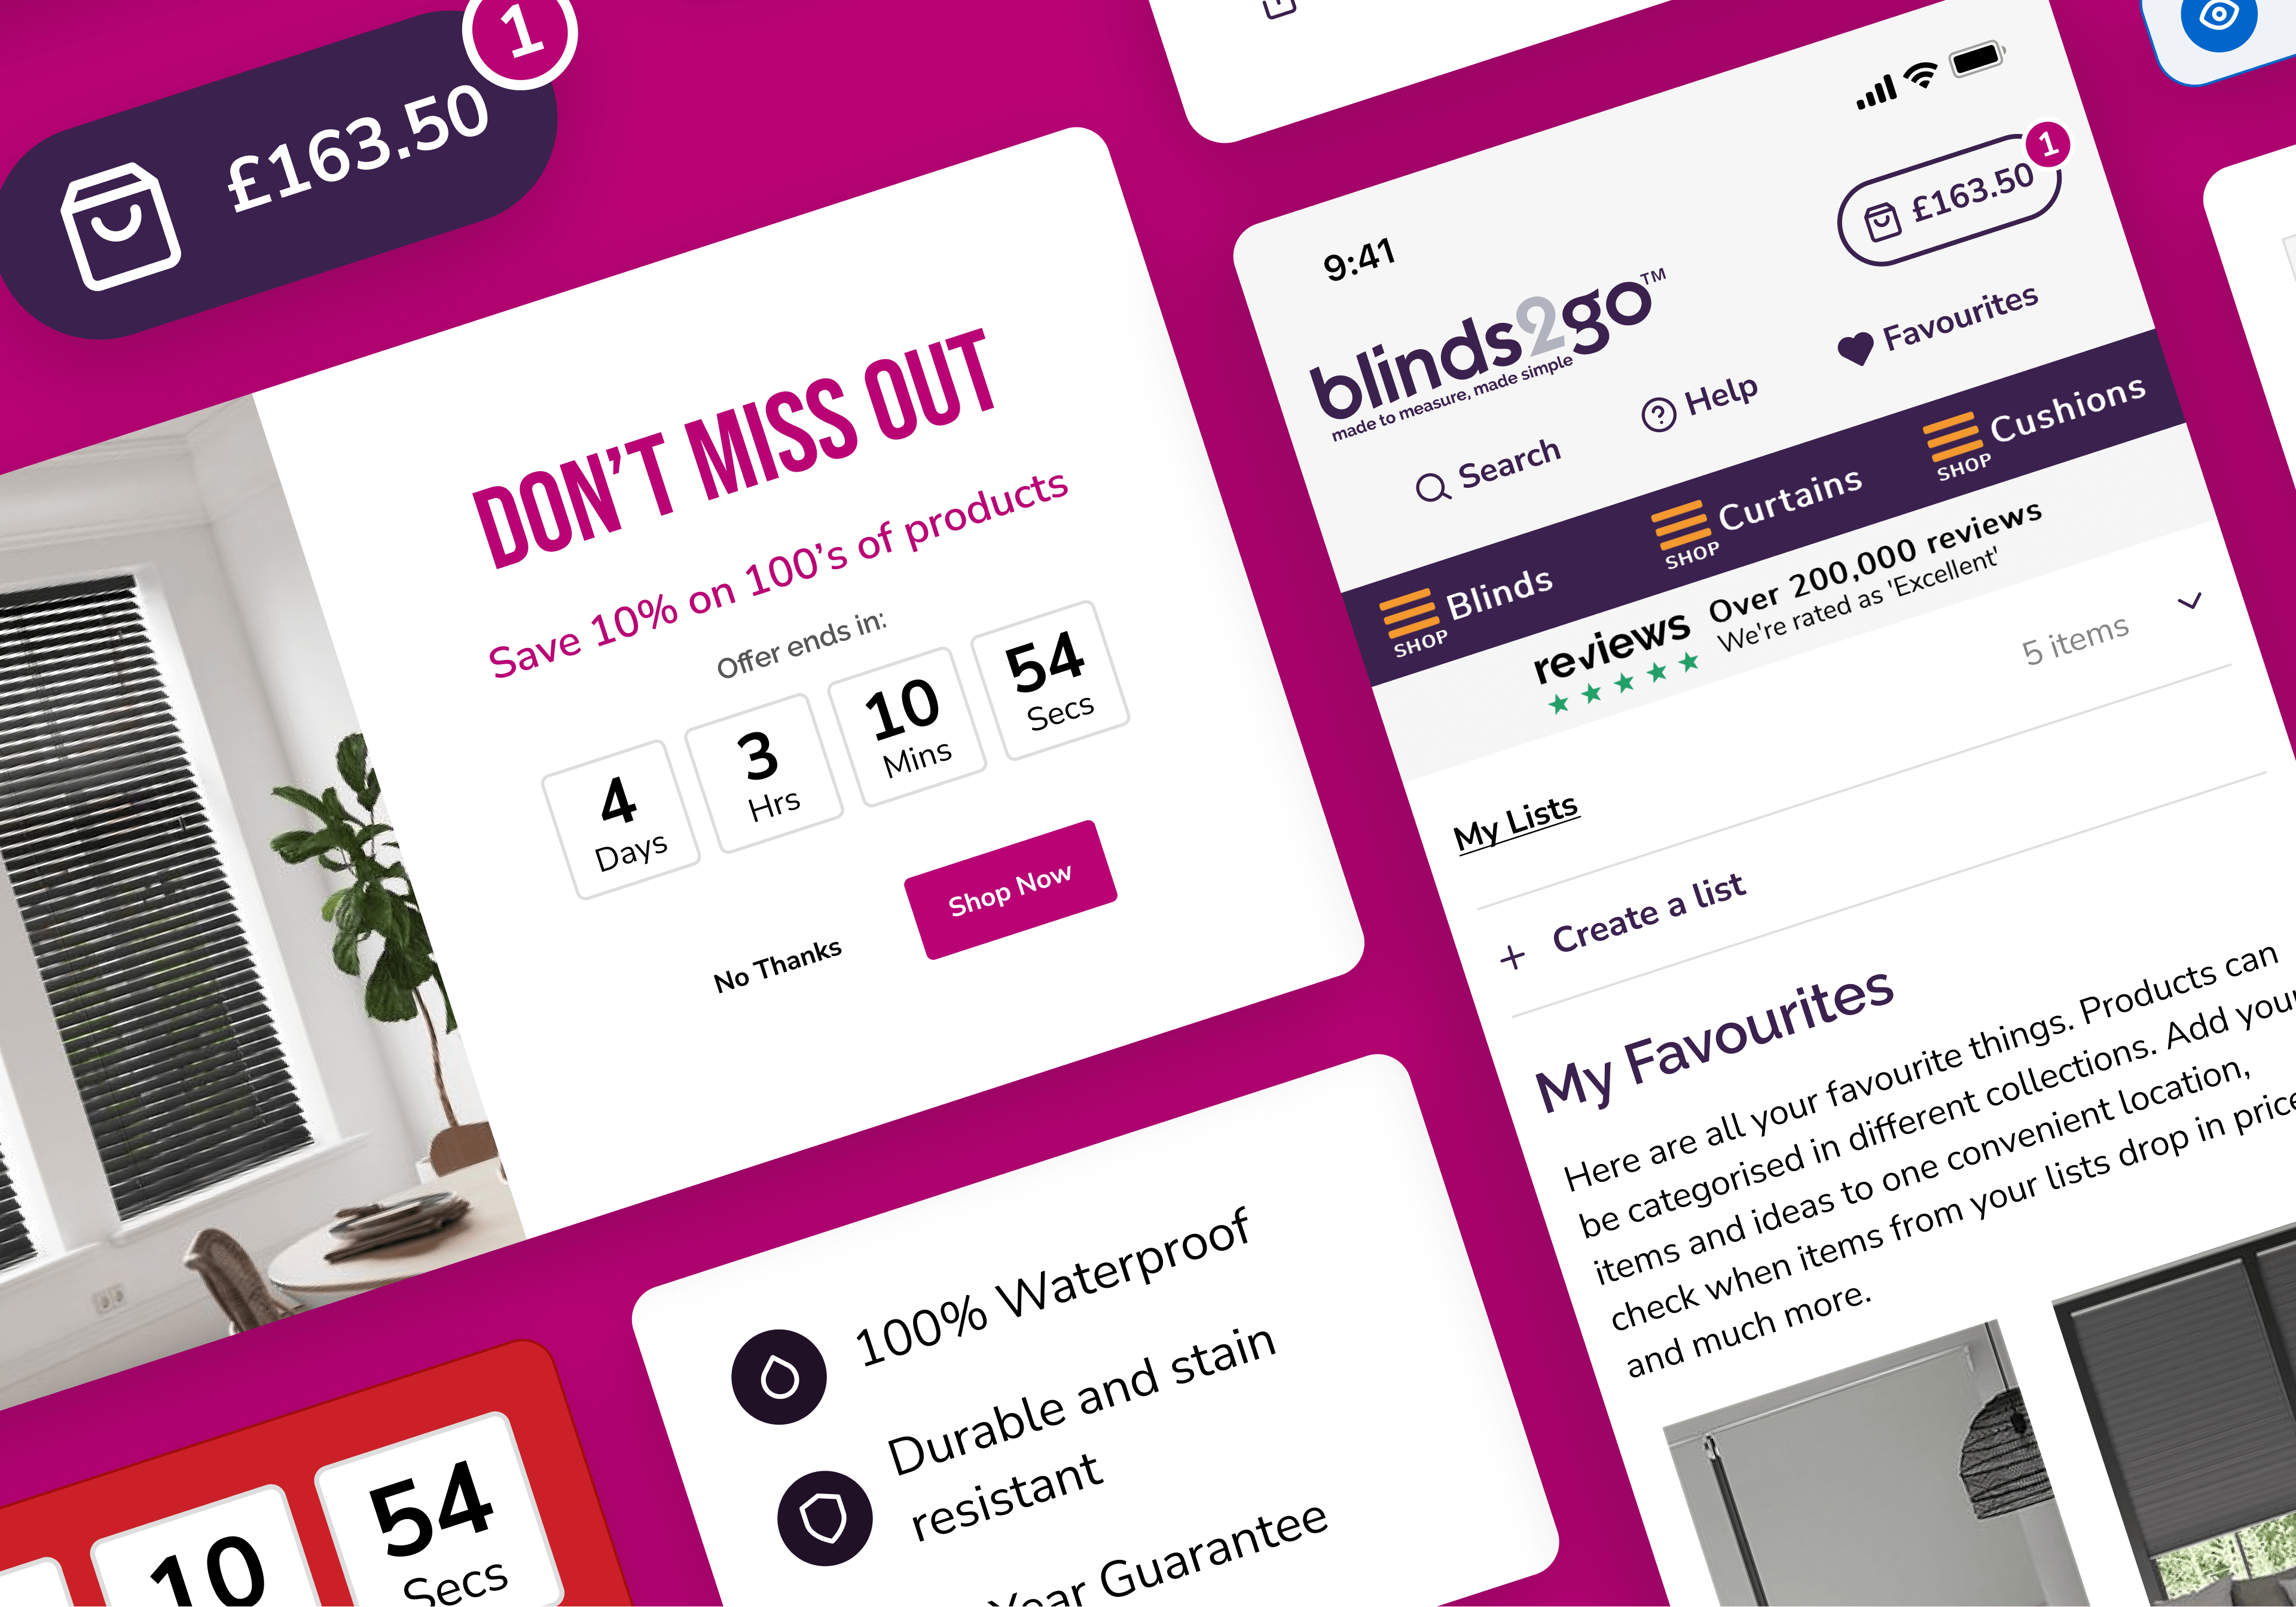
Blinds2Go
Multi-site experiments for a category leader
Frequently asked questions about our
CRO & Experimentation frameworks